aim:
in software development, step debugging is a very nice way to look at your code and see if it does what it should.
i wondered, if such a thing exists for shell / bash scripts.
develop shell bash scripts in Eclipse?: no step debugging
while this is possible, imho it might not be the right tool to use a massively complicated IDE for bash shell script editing.
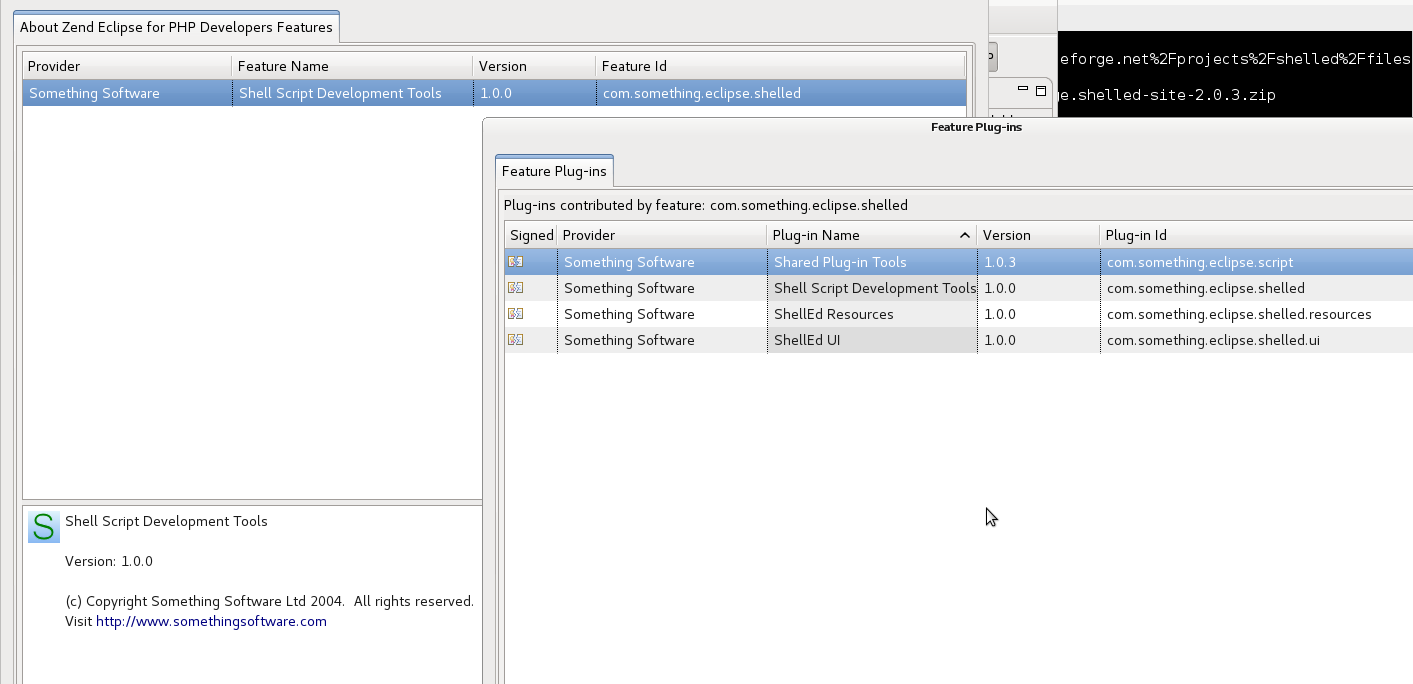
A plugin for eclipse exists called ShellEd, which one was not able to get running with the latest eclipse “requires bundle org.eclipse.dltk.core 4.0.0,6.0.0 but it could not be found”
but it worked with rather old eclipse 3.2.0… even worse, it seems, you can NOT download older versions of eclipse from: https://www.eclipse.org/downloads/
(one tried, eclipse folks seem not to be bothered with providing old versions of their IDE?)
while eclipse is a great IDE it does not seem that ShellEd is doing step debugging.
we want step debugging
so we need something else
https://sourceforge.net/p/bashdb/
there are debuggers for other shells as well:
https://sourceforge.net/projects/bashdb/files/
does the job.
while the name could suggest that it is about connecting bash to a db (database) db stands here for “DeBugging” X-D (not to be confused)
bashdb setup
i am using a rather old linux vm.
INSTALL: “If you want the bash extension command readarray that speeds up loading of large scripts than read step 3 of the long instructions especially down at the bottom.
Basically to speed up the initialy debugger loading, you need the bash source headers and need to run configure using –with-bash-src.
On systems which don’t install GNU Make by default you may have to use “gmake” instead of “make”.
In creating files and directories for the bashdb, beware that the umask of the account performing the installation is consulted as it would be for any new file or directory.
In particular, if your umask is, for example, 007, then directories that get created will have permission drwx—— which only allows that user to access the debugger support files.
Since the root account sometimes has that umask, you may want to set the umask to something more permissive like 022, before running the “make install”.
That’s it!”
“This debugger needs a debugger-enabled version of Bash 4.1 or greater.”
“It is possible to try out the debugger without installing it by using the bashdb script that is in this directory.
To do so you would invoke your script as follows, assuming you are currently in the directory (debugger) that you originally found this file in.”
$BASH -L . ./bashdb *script-to-be-debugged* *options-to-debugged-program*
where $BASH above is bash 4 with debugging enabled.
A downside to this approach is that $0 in will be “bashdb” (or more likely “./bashdb”) rather than the name of the script to be debugged.
Also, the parameters to the bashdb invocation do not appear in a stack trace.
If this is a problem, then you will have to install the debugger, or modify the script to be debugged to point to the debugger-enabled version of bash. For example if your script were in this directory (debugger) as well is your current working directory (as shown by “pwd”), then having this at the beginning of your script:
#!/some-location/bash --debugger
might also work.
For information on the differences between “bash –debugger” and bashdb, see Chapter 2 (Getting In and Out) of the bashdb documentation (bashdb.info, bashdb.html, or bashdb.texi)”
bash --version
GNU bash, version 4.4.12(1)-release (x86_64-pc-linux-gnu)
Copyright (C) 2016 Free Software Foundation, Inc.
License GPLv3+: GNU GPL version 3 or later <http://gnu.org/licenses/gpl.html>

This is free software; you are free to change and redistribute it.
There is NO WARRANTY, to the extent permitted by law.

# you might want to turn syntax vim syntax highlighting on per default
echo "syntax on" >> ~/.vimrc
# download latest version of bashdb
wget https://downloads.sourceforge.net/project/bashdb/bashdb/4.4-1.0.1/bashdb-4.4-1.0.1.tar.gz?r=https%3A%2F%2Fsourceforge.net%2Fprojects%2Fbashdb%2Ffiles%2Flatest%2Fdownload&ts=1554901391
# .... why the long url, we don't know

# unpack
tar fxvz bashdb-4.4-1.0.1.tar.gz

# step in
cd bashdb-4.4-1.0.1

./configure
make && make check
su -c 'make install'
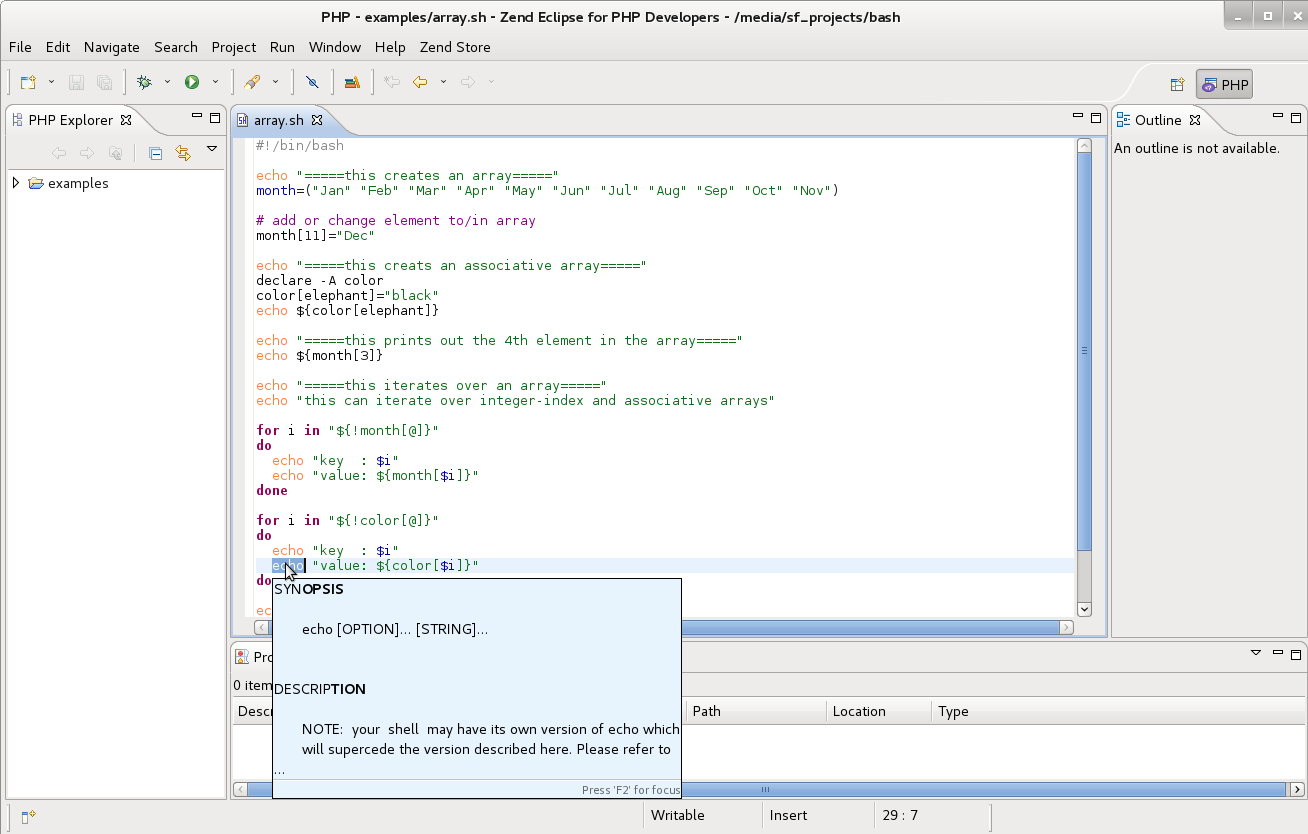
test script:
is called array.sh, and you might just copy and paste this code into a new file:
vim array.sh
#!/bin/bash

echo "=====this creates an array====="
month=("Jan" "Feb" "Mar" "Apr" "May" "Jun" "Jul" "Aug" "Sep" "Oct" "Nov")

# add or change element to/in array
month[11]="Dec"

echo "=====this creats an associative array====="
declare -A color
color[elephant]="black"
echo ${color[elephant]}

echo "=====this prints out the 4th element in the array====="
echo ${month[3]}

echo "=====this iterates over an array====="
echo "this can iterate over integer-index and associative arrays"

for i in "${!month[@]}"
do
  echo "key  : $i"
  echo "value: ${month[$i]}"
done

for i in "${!color[@]}"
do
  echo "key  : $i"
  echo "value: ${color[$i]}"
done

echo "=====print whole array====="
printf "%s\n" "${month[@]}"
printf "%s\n" "${color[@]}"
step debug test run:
bash --debugger array.sh
bash debugger, bashdb, release 4.4-1.0.1

Copyright 2002-2004, 2006-2012, 2014, 2016-2018 Rocky Bernstein
This is free software, covered by the GNU General Public License, and you are
welcome to change it and/or distribute copies of it under certain conditions.

(/projects/bash/examples/array.sh:3):
3:	echo "=====this creates an array====="
bashdb<0> ?
Available commands:
-------------------
  action     condition  edit     frame    load     run     source  unalias
  alias      continue   enable   handle   next     search  step    undisplay
  backtrace  debug      eval     help     print    set     step+   untrace
  break      delete     examine  history  pwd      shell   step-   up
  clear      disable    export   info     quit     show    tbreak  watch
  commands   display    file     kill     return   signal  trace   watche
  complete   down       finish   list     reverse  skip    tty

Readline command line editing (emacs/vi mode) is available.
Type "help" followed by command name for full documentation.

# you can now type "next" or just "n" and hit enter
# to step to the next line
(/projects/bash/examples/array.sh:4):
4:	month=("Jan" "Feb" "Mar" "Apr" "May" "Jun" "Jul" "Aug" "Sep" "Oct" "Nov")
bashdb<1> next
(/projects/bash/examples/array.sh:7):
7:	month[11]="Dec"
bashdb<2> n
bashdb<3> quit
bashdb: That's all, folks...
bashdb in emacs
A special interface allows you to use GNU Emacs to view (and edit) the source files for the program you are debugging with the BASH debugger. However you must be using GNU Emacs version 21 or greater. (
M-x show-emacs-version
inside GNU Emacs will tell you what version you are running.)
To use this interface, use the command M-x bashdb in GNU Emacs. Give the executable file you want to debug as an argument. Make sure to use the version that comes with this package as this is newer than that supplied with GNU Emacs.
The bashdb command starts the BASH debugger as a subprocess of Emacs, with input and output through a newly created Emacs buffer.
Using the BASH debugger under Emacs is just like using the BASH debugger normally except for two things:
- All “terminal” input and output goes through the GNU Emacs buffer.
This applies both to the BASH debugger commands and their output, and to the input and output done by the program you are debugging.
This is useful because it means that you can copy the text of previous commands and input them again; you can even use parts of the output in this way.
All the facilities of GNU Emacs’ Shell mode are available for interacting with your script. In particular, you can send signals the usual way—for example, C-c C-c for an interrupt, C-c C-z for a stop. (src: http://bashdb.sourceforge.net/bashdbOutline.html#SEC71)
full documentation:
Debugging with the BASH debugger
This file describes the BASH debugger, the BASH symbolic debugger.
This is the 4.4-1.0.2git Edition, 17 November 2018, for BASH.
Copyright (C) 2002-2009, 2011, 2016 Rocky Bernstein
| 1. Summary of the BASH Debugger | Overview of Debugger with a sample session | |
| 2. Getting in and out | ||
| 3. Script Setup inside the BASH Debugger | Script setup inside the BASH debugger | |
| 4. BASH Debugger Command Reference | BASH debugger command reference | |
| 5. Reporting Bugs | Reporting bugs | |
| 6. History and Acknowledgments | ||
Appendices |
||
|---|---|---|
| A. GNU GENERAL PUBLIC LICENSE | GNU General Public License says how you can copy and share bashdb | |
| B. GNU Free Documentation License | The license for this documentation | |
Indexes (nodes containing large menus) |
||
| Command Index | An item for each command name. | |
| General Index | An item for each concept. | |
| [ < ] | [ > ] | [ << ] | [ Up ] | [ >> ] | [Top] | [Contents] | [Index] | [ ? ] |
1. Summary of the BASH Debugger
The purpose of a debugger such as the BASH debugger is to allow you to see what is going on “inside” a bash script while it executes.
the BASH debugger can do four main kinds of things (plus other things in support of these) to help you catch bugs in the act:
- Start your script, specifying anything that might affect its behavior.
- Make your script stop on specified conditions.
- Examine what has happened, when your script has stopped.
- Change things in your script, so you can experiment with correcting the effects of one bug and go on to learn about another.
Although you can use the BASH debugger to debug scripts written in BASH, it can also be used just as a front-end for learning more about programming in BASH. As an additional aid, the debugger can be used within the context of an existing script with its functions and variables that have already been initialized; fragments of the existing can be experimented with by entering them inside the debugger.
| 1.1 A Sample BASH Debugger Session | A Sample BASH Debugger session | |
| 1.2 Interactive Line Tracing Session |
| [ < ] | [ > ] | [ << ] | [ Up ] | [ >> ] | [Top] | [Contents] | [Index] | [ ? ] |
1.1 A Sample BASH Debugger Session
You can use this manual at your leisure to read all about the BASH debugger. However, a handful of commands are enough to get started using the debugger. This chapter illustrates those commands.
Below we will debug a script that contains a function to compute the factorial of a number: fact(0) is 1 and fact(n) is n*fact(n-1).
$ bashdb -L .  /tmp/fact.sh
Bourne-Again Shell Debugger, release bash-4.4-1.0.2git
Copyright 2002, 2003, 2004, 2006, 2007, 2008, 2009, 2011 Rocky Bernstein
This is free software, covered by the GNU General Public License, and you are
welcome to change it and/or distribute copies of it under certain conditions.

(/tmp/fact.sh:9):
  9:	echo fact 0 is: `fact 0`
bashdb<0> -
  1:    #!/usr/local/bin/bash
  2:    fact() {
  3:    ((n==0)) && echo 1 && return
  4:    ((nm1=n-1))
  5:    ((result=n*`fact $nm1`))
  6:    echo $result
  7:    }
  8:
  9:==> echo fact 0 is: `fact 0`
bashdb<1> list
 10:   echo fact 3 is: $(fact 3)
|
The command invocation uses the option “-L .” Here we assume that the
bashdb
script and the debugger files are in the same location. If you are running from the source code, this will be the case. However if bashdb has been installed this probably won’t be true and here you probably don’t need to use “-L .” Instead you would type simply
bashdb /tmp/fact.sh
.
Position information consists of a filename and line number, e.g.
(/tmp/fact.sh:9)
and is given parenthesis. This position format is similar to that used in a dozen or so other debuggers; GNU Emacs and DDD can parse this format.
In the first debugger command we gave -, we listed a window of lines before where we were executing. Because the window, 10 lines, is larger than the number of lines to the top of the file we printed only 9 lines here. The next command,
list
, starts from the current line and again wants to print 10 lines but because there are only one remaining line, that is what is printed.
|
Ooops… The variable n isn’t initialized.(1)
The first step command steps the script one instruction. It may seem odd that the line printed is exactly the same one as before. What has happened though is that we’ve “stepped” into the subshell needed to run `fact 0`; we haven’t however started running anything inside that subshell yet though.
To indicate that which piece of the multi-part line
echo fact 0
is: `fact 0`
we show that part all by itself fact 0. If nothing is shown then it means we are running the beginning statement or in this case the outermost statement.
To indicate that we are now nested in a subshell, notice that the command number, starting with 3, or the third command entered, now appears in parenthesis. Each subshell nesting adds a set of parenthesis.
The first step command steps the script one instruction; it didn’t advance the line number, 9, at all. That is because we were stopping before the command substitution or backtick is to take place. The second command we entered was just hitting the return key; bashdb remembers that you entered
step
previously, so it runs the step rather than next, the other alternative when you hit <RET>. Step one more instruction and we are just before running the first statement of the function.
Next, we print the value of the variable n. Notice we need to add a preceding dollar simple to get the substitution or value of n. As we will see later, if the pe command were used this would not be necessary.
We now modify the file to add an assignment to local variable n and restart.
|
This time we use the
list
debugger command to list the lines in the file. From before we know it takes three
step
commands before we get into the fact() function, so we add a count onto the
step
command. Notice we abbreviate
step
with
s
; we could have done likewise and abbreviated
list
with
l
.
|
Again we just use <RET> to repeat the last
step
commands. And again the fact that we are staying on the same line 4 means that the next condition in the line is about to be executed. Notice that we see the command (
echo 1
or
return
) listed when we stay on the same line which has multiple stopping points in it. Given the information above, we know that the value echo’ed on return will be 1.
|
We saw that we could step with a count into the function fact(). However above took another approach: we set a stopping point or “breakpoint” at line 5 to get us a little ways into the fact() subroutine. Just before line 5 is to executed, we will get back into the debugger. The
continue
command just resumes execution until the next stopping point which has been set up in some way.
|
In addition to listing by line numbers, we can also list giving a function name. Below, instead of setting a breakpoint at line 5 and running “
continue
” as we did above, we try something slightly shorter and slightly different. We give the line number on the “continue” statement. This is a little different in that a one-time break is made on line 5. Once that statement is reached the breakpoint is removed.
|
When we stop at line 5 above, we have already run fact(0) and output the correct results. The output from the program “fact 0 is: 1” is intermixed with the debugger output. The
T
command above requests call stack output and this confirms that we are not in the fact(0) call but in the fact(3) call. There are 4 lines listed in the stack trace even though there is just one call from the main program. The top line of the trace doesn’t really represent a call, it’s just where we currently are in the program. That last line is an artifact of invoking bash from the bashdb script rather than running
bash --debugger
.
The last message in the output above ‘Debugged program exited normally.’ is from the BASH debugger; it indicates script has finished executing. We can end our bashdb session with the
quit
command.
Above we did our debugging session on the command line. If you are a GNU Emacs user, you can do your debugging inside that. Also there is a(nother) GUI interface called DDD that supports the BASH debugger.
| [ < ] | [ > ] | [ << ] | [ Up ] | [ >> ] | [Top] | [Contents] | [Index] | [ ? ] |
1.2 Interactive Line Tracing Session
One of the things I had found disappointing about the default
set -x
tracing behavior is that no position information is given in the trace output, in particular the line number and the file name. However with the introduction in Bash 3.0 of the introspection variables, also needed to support the debugger, one can set
$PS4
to rectify this. (I became of this in a defunct blog http://raz.cx/blog/2005/08/handy-bash-debugging-trick.html.)
Here’s what I use:
  PS4='(${BASH_SOURCE}:${LINENO}): ${FUNCNAME[0]} - [${SHLVL},${BASH_SUBSHELL}, $?]
'
|
Note that the string is in single quotes, not double quotes and there is a newline in the string. By using single quotes, variables which have a dollar in front of them in the string are expanded in the current environment of the line that is about to be run rather than at the time the variable
PS4
is set.
You might want to add this in your shell’s start-up script, e.g.,
.bashrc
, or
.profile
.
There is also facility inside the bash debugger showing position information when tracing a script. Here’s a simple session.
/usr/local/bin/bashdb /tmp/fact.sh
Bourne-Again Shell Debugger, release bash-4.4-1.0.2git
Copyright 2002, 2003, 2004, 2006, 2007, 2008 Rocky Bernstein
This is free software, covered by the GNU General Public License, and you are
welcome to change it and/or distribute copies of it under certain conditions.

(/tmp/fact.sh:11):
11:	echo fact 0 is: `fact 0`
bashdb<0> set linetrace on
bashdb<1> cont
(/tmp/fact.sh:11):
level 1, subshell 1, depth 0:	echo fact 0 is: `fact 0`
fact 0
(/tmp/fact.sh:2):
level 1, subshell 1, depth 1:	fact() {
(/tmp/fact.sh:3):
level 1, subshell 1, depth 1:	    local -i n=${1:0}
(/tmp/fact.sh:4):
level 1, subshell 1, depth 1:	    ((n==0)) && echo 1 && return
(/tmp/fact.sh:4):
level 1, subshell 1, depth 1:	    ((n==0)) && echo 1 && return
echo 1
(/tmp/fact.sh:4):
level 1, subshell 1, depth 1:	    ((n==0)) && echo 1 && return
return
fact 0 is: 1
(/tmp/fact.sh:13):
level 1, subshell 0, depth 0:	echo fact 3 is: $(fact 3)
(/tmp/fact.sh:13):
level 1, subshell 1, depth 0:	echo fact 3 is: $(fact 3)
fact 3
(/tmp/fact.sh:2):
level 1, subshell 1, depth 1:	fact() {
(/tmp/fact.sh:3):
level 1, subshell 1, depth 1:	    local -i n=${1:0}
(/tmp/fact.sh:4):
level 1, subshell 1, depth 1:	    ((n==0)) && echo 1 && return
(/tmp/fact.sh:5):
level 1, subshell 1, depth 1:	    ((nm1=n-1))
(/tmp/fact.sh:6):
level 1, subshell 1, depth 1:	    ((fact_nm1=`fact $nm1`))
(/tmp/fact.sh:6):
level 1, subshell 2, depth 1:	    ((fact_nm1=`fact $nm1`))
fact $nm1
(/tmp/fact.sh:2):
level 1, subshell 2, depth 2:	fact() {
...
level 1, subshell 4, depth 4:	fact() {
(/tmp/fact.sh:3):
level 1, subshell 4, depth 4:	    local -i n=${1:}
(/tmp/fact.sh:4):
level 1, subshell 4, depth 4:	    ((n==0)) && echo 1 && return
(/tmp/fact.sh:4):
level 1, subshell 4, depth 4:	    ((n==0)) && echo 1 && return
echo 1
(/tmp/fact.sh:4):
level 1, subshell 4, depth 4:	    ((n==0)) && echo 1 && return
return
(/tmp/fact.sh:7):
level 1, subshell 3, depth 3:	    ((result=n*fact_nm1))
(/tmp/fact.sh:8):
level 1, subshell 3, depth 3:	    echo $result
(/tmp/fact.sh:7):
level 1, subshell 2, depth 2:	    ((result=n*fact_nm1))
(/tmp/fact.sh:8):
level 1, subshell 2, depth 2:	    echo $result
(/tmp/fact.sh:7):
level 1, subshell 1, depth 1:	    ((result=n*fact_nm1))
(/tmp/fact.sh:8):
level 1, subshell 1, depth 1:	    echo $result
fact 3 is: 6
(/usr/local/bin/bashdb:260):
level 1, subshell 0, depth -1:
Debugged program terminated normally. Use q to quit or R to restart.
bashdb<2>
|
An explanation of the output. The level is how many invocations of BASH are in effect before the statement shown is executed. The subshell is how many subshells you are nested in. Subshells are used by command substitution—
`..'
and
$(...)
—as well as arithmetic expressions
((...))
. The depth is the function depth or how many calls you are nested in. A “source” command also increases this depth.
Notice also that in contrast to
set -x
tracing, the line shown is exactly as you entered it in the source. So if you indented statements in a meaningful way, it will help you understand the statement nesting level. But as before, if a line contains multiple statements, you are not executing the first statement in the line and
set showcommand
is not turned off (by default it is on), that statement is shown in addition below the multi-statement line. Such an example can be seen right at the beginning where
fact 0
is shown.
If what you want to do is trace the entire script as was done above (and not stop in the debugger when the script is over), you can get the same effect by using the
-X
or
--trace
option on the bashdb command:
/usr/local/bin/bashdb -X /tmp/fact.sh
Bourne-Again Shell Debugger, release bash-4.4-1.0.2git
Copyright 2002, 2003, 2004, 2006, 2007, 2008, 2009, 2011 Rocky Bernstein
This is free software, covered by the GNU General Public License, and you are
welcome to change it and/or distribute copies of it under certain conditions.

(/usr/local/bin/bashdb:272):
level 1, subshell 0, depth -1:	  . $_source_file
(/tmp/fact.sh:11):
level 1, subshell 0, depth 0:	echo fact 0 is: `fact 0`
(/tmp/fact.sh:11):
level 1, subshell 1, depth 0:	echo fact 0 is: `fact 0`
fact 0
(/tmp/fact.sh:2):
level 1, subshell 1, depth 1:	fact() {
(/tmp/fact.sh:3):
level 1, subshell 1, depth 1:	    local -i n=${1:0}
...
level 1, subshell 2, depth 2:	    echo $result
(/tmp/fact.sh:7):
level 1, subshell 1, depth 1:	    ((result=n*fact_nm1))
(/tmp/fact.sh:8):
level 1, subshell 1, depth 1:	    echo $result
fact 3 is: 6
(/usr/local/bin/bashdb:285):
level 1, subshell 0, depth -1:
|
If you issue a break (e.g. send a
SIGINT
signal) while the program is running you will go into the debugger (assuming your program doesn’t trap
SIGINT
).
| [ < ] | [ > ] | [ << ] | [ Up ] | [ >> ] | [Top] | [Contents] | [Index] | [ ? ] |
2. Getting in and out
This chapter discusses how to start the BASH debugger, and how to get out of it. The essentials are:
- type ‘bash –debugger script-name’ or ‘bashdb script-name’ to start the BASH debugger. Or…
- type ‘bashdb -c command string’ to give a string to run under the debugger. Or ..
- modify your program to enter the debugger at a particular point:
source ../bashdb-trace
and
_Dbg_debugger
.
- type quit or C-d inside the debugger to exit.
There are also two front-ends available as well. An emacs front-end which has bashdb support among others is https://github.com/rocky/emacs-dbgr/wiki.
| 2.1 Starting the BASH debugger | How to enter the BASH debugger | |
2.2
Quitting the BASH de |
How to leave the BASH debugger | |
| 2.3 Calling the BASH debugger from inside your program | Calling the debugger from inside your program |
| [ < ] | [ > ] | [ << ] | [ Up ] | [ >> ] | [Top] | [Contents] | [Index] | [ ? ] |
2.1 Starting the BASH debugger
Note: it is important to use a debugger-enabled bash. You will get an error message if the debugger is run under a version of BASH that does not have debugging support.
As mentioned above, one can enter the BASH debugger via Emacs or DDD. However you don’t have to use either of these. And these still need a way on their own to get things started.
There are in fact two other ways to start the BASH debugger. The first way is to pass the ‘–debugger’ option to bash with the name of your script the scripts arguments following that, or with a command string (
-c
).
| 2.1.1 Debugging a bash string from the command line | ||
| 2.1.2 Having bash invoke the debugger and your shell script | ||
| 2.1.3 Having the debugger invoke your shell script |
| [ < ] | [ > ] | [ << ] | [ Up ] | [ >> ] | [Top] | [Contents] | [Index] | [ ? ] |
2.1.1 Debugging a bash string from the command line
bash --debugger -c command-string... |
This form can be used to get into the debugger without having to give a script name to debug. Sometimes you may want to do this just to see how the debugger works: try some debugger commands or maybe get online help. If you run
ddd --bash
without giving a script name, it in fact uses this form.
| [ < ] | [ > ] | [ << ] | [ Up ] | [ >> ] | [Top] | [Contents] | [Index] | [ ? ] |
2.1.2 Having bash invoke the debugger and your shell script
bash --debugger script script-arguments... |
This calls a debugger initialization script. It works much like a BASH login profile which may set variables and define functions. But this shell profile is customized for debugging and as such arranges for itself to get called before each statement is executed. Although there are some problems at present in I/O redirection that the method described next doesn’t have, it is expected that over time more features will be enabled in bash when the ‘–debugger’ option is in effect.
When you use ‘bash –debugger’ and the bash script you want to debug needs arguments, you need to disambiguate which place arguments are to be sent to: bash, or your program.
To disambiguate add ‘—’ after your script name. For example:
bash --debugger ~/path/to/my/myscript.sh -- -o sample.out --option2 |
Without the ‘—’, bash will thing that ‘-o sample.out‘ is to be handled by bash, rather than ‘myscript.sh’.
Alternatively you can set arguments the debuggerd script using bash’s ‘set’ command like this:
set -o sample.out --option2 |
| [ < ] | [ > ] | [ << ] | [ Up ] | [ >> ] | [Top] | [Contents] | [Index] | [ ? ] |
2.1.3 Having the debugger invoke your shell script
A downside of running script the way described in the previous section, via ‘–debugger’, you must have the debugger scripts installed in a place where the installed bash can find them. For this reason, in developing the BASH debugger, I use a second method more often; it doesn’t require the bash debugger to be installed. This method uses another script called bashdb which allows for giving its own options, the final option is signaled by adding
--
). After this, the name of the script to debugged and any the arguments to pass to that script are given. Using this method, one would start the debugger like this:
bash path-to-bashdb/bashdb script bashdb-options -- script-arguments... |
If there is no possibilty of the BASH debugger confusing the program options with those used in your bash script, yyou don’t need to pass dash options to your program.
As with the first method,
bash
should be a debugger-enabled bash. If bashdb has the path to bash in it at the top (e.g. via
#!
), and bashdb can be found in your program-search path, then this might be equivalent to the above:
bashdb bashdb-options script -- script-arguments... |
There are two or three disadvantages however of running a debugger this way. First
$0
will have the value bashdb rather than the script you are trying to run. For some scripts this may change the behavior of the debugged script. Second a traceback will contain additional lines showing the “source”-ing of the debugged script from bashdb. And third, although this way works better than the first method, over time this way may come into disuse.
An option that you’ll probably need to use if bashdb isn’t installed but run out of the source code directory is ‘-L’ which specifies the directory that contains the debugger script files.
You can further control how bashdb starts up by using command-line options. bashdb itself can remind you of the options available.
Type
bashdb -h |
to display all available options and briefly describe their use.
When the bash debugger is invoked either by the bashdb front-end script or
bash --debugging
, the first argument that does not have an associated option flag for bashdb or
bash
(as the case may be) is used as the name a the script file to be debugged, and any following options get passed the debugged script.
Options for the bashdb front-end are shown in the following list.
| 2.1.3.1 Command-line options for bashdb script | Options you can pass in starting bashdb |
| [ < ] | [ > ] | [ << ] | [ Up ] | [ >> ] | [Top] | [Contents] | [Index] | [ ? ] |
2.1.3.1 Command-line options for bashdb script
You can run the BASH debugger in various alternative modes—for example, in batch mode or quiet mode.
-
-h | --help
- This option causes the BASH debugger to print some basic help and exit.
-
-V | --version
- This option causes the BASH debugger to print its version number, no-warranty blurb, and exit.
-
-A | --annodate level
- Add additional output which allows front-ends to track what’s going on without having to poll for such vital information. The default annotation level is 0 (none). If you are running inside GNU Emacs using the Emacs code from this package, an annotation level 3 when set will allow for automatic tracking of frames and breakpoints. See section Annotation Level (‘set annotate’).
-
-c | --command cmd
- Run the string instead of running a script
-
-B | --basename
- This option causes the BASH debugger to print its version number and no-warranty blurb, and exit.
-
-n | --nx | --no-init
- Do not execute commands found in any initialization files. Normally, BASH executes the commands in these files after all the command options and arguments have been processed. See section Command files.
-
-q | --quiet
- “Quiet”. Do not print the introductory and copyright messages. These messages are also suppressed in batch mode.
-
-t | --terminal | --tty tty
- Debugger output usually goes to a terminal rather than
STDOUT
which the debugged program may use. Determination of the tty or pseudo-tty is normally done automatically. However if you want to control where the debugger output goes, use this option.
If you want output to go to C<STDOUT>, use C<&1>. Note: the C<&> may have to be escaped or quoted to avoid shell interpretation with forking.
-
-x | --eval-command
- execute debugger commands from cmdfile.
-
-L | --library directory
- Set directory where debugger files reside to directory. The default location is
../lib/bashdb
relative to the place that the bashdb script is located. For example if bashdb is located in
/usr/bin/bashdb
, the default library location will be
/usr/lib/bashdb
which may or may not exist. If it doesn’t you’ll get an error when you run bashdb. Only if the default location is incorrect, should you need to use the
-L
option.
-
-T | --tempdir directory
- Set directory to use for writing temporary files.
| [ < ] | [ > ] | [ << ] | [ Up ] | [ >> ] | [Top] | [Contents] | [Index] | [ ? ] |
2.2 Quitting the BASH debugger
An interrupt (often C-c) does not exit from the BASH debugger, but rather terminates the action of any the BASH debugger command that is in progress and returns to the BASH debugger command level. Inside a debugger command interpreter, use
quit
command (see section Quitting the BASH debugger).
There way to terminate the debugger is to use the
kill
command. This does more forceful
kill -9
. It can be used in cases where
quit
doesn’t work.
| [ < ] | [ > ] | [ << ] | [ Up ] | [ >> ] | [Top] | [Contents] | [Index] | [ ? ] |
2.3 Calling the BASH debugger from inside your program
Running a program from the debugger adds a bit of overhead and slows down your program quite a bit. Addressing this better would mean some serious changes to BASH internals, and judging from experience in other languages there still the slowdown is still noticeable. If you have a
configure
script generated by autoconf, and you want to stop in the middle of the script, it can take quite a while.
Furthermore, by necessity, debuggers change the operation of the program they are debugging. And this can lead to unexpected and unwanted differences. It has happened so often that the term “Heisenbugs” (see http://en.wikipedia.org/wiki/Heisenbug) was coined to describe the situation where the addition of the use of a debugger (among other possibilities) changes behavior of the program so that the bug doesn’t manifest itself anymore.
There is another way to get into the debugger aside from calling bashdb from the outset, and this adds no overhead or slowdown until you reach the point at which you want to start debugging. However for this method you must change the script. Because the debugger isn’t involved before the first call, there is no overhead; the script will run at the same speed as if there were no debugger up to the point where it is first invoked.
| 2.3.1 Debugging a Running Shell Script | ||
| 2.3.2 Program-Controlled Line Tracing |
| [ < ] | [ > ] | [ << ] | [ Up ] | [ >> ] | [Top] | [Contents] | [Index] | [ ? ] |
2.3.1 Debugging a Running Shell Script
In this section we’ll show how to modify your script so that it enters the debugger when you send it a signal, and then we will show how you can call the debugger directly.
In either case, you’ll need to modify the script to load some the debugger code. The name of file to load is
bashdb-trace
and it is located in the directory where the other bash debugger files live. For example on GNU/Linux if it is in directory
/usr/local/share/bashdb
, you would first add to a BASH script the line:
source /usr/local/share/bashdb/bashdb-trace |
Although I said that running under the debugger adds overhead which slows down you program, the above command in of itself will not cause any slowdown. If possible, it’s best to put this somewhere in the main-line code rather than in a function or in a subshell. If it is put in a function of subshell and you step outside of that, some of the global variables set up in
bashdb-trace
may be lost. One the other hand if you know your debugging will be confined to just the scope of the
source
command there is no problem.
Here’s a complete example. In file ‘debugit.sh’
# This is my extra debug hook
  source /usr/share/bashdb/bashdb-trace # adjust location

  echo $$
  while : ; do
        date=$(date)
        echo "$date"
        sleep 2
  done
|
Now run:
$ bash ./debugit.sh Bourne-Again Shell Debugger, release bash-3.1-0.08 Copyright 2002, 2003, 2004, 2006 Rocky Bernstein This is free software, covered by the GNU General Public License, and you are welcome to change it and/or distribute copies of it under certain conditions. 9435 Thu Jun 19 02:43:06 EDT 2008 Thu Jun 19 02:43:08 EDT 2008 |
Sent it an “interrupt” signal
kill -INT 9435 |
And back to the running program:
  Program received signal SIGINT (2)...
  ->0 in file `./debugit.sh' at line 251  # not sure where 251 came from!
  ##1 main() called from file `./debugit.sh' at line 0
  bashdb<0> where
  ->0 in file `./debugit.sh' at line 9    # but this line number is now right
  ##1 main() called from file `./debugit.sh' at line 0
  bashdb<1> list 1
    1:   # Set up some interrupt handlers to go into the debugger
    2:   source /usr/share/bashdb/bashdb-trace
    3:
    4:   echo $$
    5:   while : ; do
    6:   date=$(date)
    7:   echo "$date"
    8:   sleep 2
    9:==>done
  bashdb<2> step
  (./debugit.sh:5):
  5:      while : ; do
  bashdb<3> step
  (./debugit.sh:6):
  6:      date=$(date)
  bashdb<4> continue -
|
The command
continue -
not only continues execution but it removes the debug trap allowing the program to run at full speed. It is suitable only if there are no breakpoints that you care to stop at.
By default,
bashdb-trace
sets up a handler for the ‘INT’ exception. If you down’t want this or you want enter the debugger on a different signal to be use,
_Dbg_handler
. With this function you can specify whether to show a call stack, stop (enter the debugger) and/or print an indication that the a signal was seen.
Here are some examples:
    _Dbg_handler INT print showstack nostop  # this is the default
    _Dbg_handler INT                         # same thing
    _Dbg_hander                              # same thing
    _Dbg_handler HUP print stop              # stop in debugger when getting
|
| [ < ] | [ > ] | [ << ] | [ Up ] | [ >> ] | [Top] | [Contents] | [Index] | [ ? ] |
2.3.1.1 Explicit Debugging Calls.
As we saw in the last section
bashdb-trace
installs some signal handlers. However you can make an explicit call to the debugger
_Dbg_debugger |
Let’s show an example of that. We’ll even do it under a condition:
  for ((i=1; i<=10; i++)) ;
        (( 5 == i )) && { _Dbg_debugger }
        date=$(date)
        echo "$date"
        sleep 2
  done
|
The debugger will be called on the 5th iteration of this loop, when
i
has the value 5.
You can also supply the number of statements to skip and the options to
_Dbg_debugger
just as you would to the debugger itself. All of the options listed in Command-line options for bashdb script can be used with the exception of
-c
(run a command) and of course you don’t supply the name of a BASH script.
For example to stop at the next line and suppress the banner you could use
_Dbg_debugger 1 -q
in the above example.
| [ < ] | [ > ] | [ << ] | [ Up ] | [ >> ] | [Top] | [Contents] | [Index] | [ ? ] |
2.3.2 Program-Controlled Line Tracing
You can also turn on and off line tracing. Here’s an example
  source path-to-program/bashdb-trace # modify location
   ...
  _Dbg_linetrace_on
  for i in `seq 10` ; do
     echo $i
  done
  _Dbg_linetrace_off
   _Dbg_QUIT_ON_QUIT=1
|
The
_Dbg_QUIT_ON_QUIT
variable make sure the program doesn’t stay inside the debugger after it quits. It can also be set earlier in the program.
Again
<path-to-program>
is whatever path needed to located
<bashdb-trace>
. For example it might be
</usr/local/share>
on some GNU/Linux installations.
| [ < ] | [ > ] | [ << ] | [ Up ] | [ >> ] | [Top] | [Contents] | [Index] | [ ? ] |
3. Script Setup inside the BASH Debugger
| 3.1 Starting your script | ||
| 3.2 Command files | ||
| 3.3 Your script’s arguments | ||
| 3.4 Your script’s input and output | ||
| 3.5 Script/Debugger Interaction | Keeping out of each other’s harm |
| [ < ] | [ > ] | [ << ] | [ Up ] | [ >> ] | [Top] | [Contents] | [Index] | [ ? ] |
3.1 Starting your script
After invoking the debugger you should be on the first stoppable line of your program to be debugged. At this point you can issue debugger commands to set breakpoints (see section Setting breakpoints), or watchpoints (see section Setting watchpoints), or start continue the execution of the program (see section Resuming Execution).
-
restart [args]
-
run [args]
-
R [args]
- Use the
restart
command to restart your script under the BASH debugger. Without any arguments, the script name and parameters from the last invocation are used. The BASH debugger tries to maintain the settings, watchpoints, breakpoints, actions and so on. Internally it uses line numbers and filenames to record he position of interesting places in your program; so if your program changes some or all of these numbers may be off. Environment variable
DBG_RESTART_FILE
is and a temporary file are used to signal a restart, so you shouldn’t uset
DBG_RESTART_FILE
(or any environment variable starting with
BASHDB_
.
| [ < ] | [ > ] | [ << ] | [ Up ] | [ >> ] | [Top] | [Contents] | [Index] | [ ? ] |
3.2 Command files
A command file for the BASH debugger is a file of lines that are the BASH debugger commands. Comments (lines starting with #) may also be included. An empty line in a command file does nothing; it does not mean to repeat the last command, as it would from the terminal.
When you start the BASH debugger, it automatically executes commands from its init files, normally called ‘.bashdbinit’(2). During startup, the BASH debugger does the following:
- Reads the init file (if any) in your home directory(3).
- Processes command line options and operands.
- Reads the init file (if any) in the current working directory.
- Reads command files specified by the ‘-x’ option.
The init file in your home directory can set options (such as ‘set complaints’) that affect subsequent processing of command line options and operands. Init files are not executed if you use the ‘-x’ option (see section bashdb script options).
On some configurations of the BASH debugger, the init file is known by a different name (these are typically environments where a specialized form of the BASH debugger may need to coexist with other forms, hence a different name for the specialized version’s init file). These are the environments with special init file names:
You can also request the execution of a command file with the
source
command:
The lines in a command file are executed sequentially. They are not printed as they are executed. If there is an error, execution proceeds to the next command in the file.
| [ < ] | [ > ] | [ << ] | [ Up ] | [ >> ] | [Top] | [Contents] | [Index] | [ ? ] |
3.3 Your script’s arguments
The arguments to your script can be specified by the arguments of the
restart
command. They are passed to a shell, which expands wild-card characters and performs redirection of I/O, and thence to your script.
restart
with no arguments uses the same arguments used by the previous
restart
, or those set by the
set args
command..
-
set args
- Specify the arguments to be used if your program is rerun. If
set args
has no arguments,
restart
executes your program with no arguments. Once you have run your program with arguments, using
set args
before the next
restart
is the only way to run it again without arguments.
-
show args
- Show the arguments to give your program when it is started.
| [ < ] | [ > ] | [ << ] | [ Up ] | [ >> ] | [Top] | [Contents] | [Index] | [ ? ] |
3.4 Your script’s input and output
By default, the script you run under the BASH debugger does input and output to the same terminal that BASH uses. Before running the script to be debugged, the debugger records the tty that was in effect. All of its output is then written to that. However you can change this when using the ‘bashdb’ script using the ‘-t’ option.
-
info terminal
- Displays information recorded by the BASH debugger about the terminal modes your program is using.
Another way to specify where your script should do input and output is with the
tty
command. This command accepts a file name as argument, and causes this file to be the default for future
restart
commands. It also resets the controlling terminal for the child process, for future
restart
commands. For example,
tty /dev/ttyb |
directs that processes started with subsequent
restart
commands default to do input and output on the terminal ‘/dev/ttyb’ and have that as their controlling terminal.
An explicit redirection in
restart
overrides the
tty
command’s effect on the input/output device, but not its effect on the controlling terminal.
When you use the
tty
command or redirect input in the
restart
command, only the input for your script is affected. The input for the BASH debugger still comes from your terminal.
| [ < ] | [ > ] | [ << ] | [ Up ] | [ >> ] | [Top] | [Contents] | [Index] | [ ? ] |
3.5 Script/Debugger Interaction
The BASH debugger and your program live in the same variable space so to speak. BASH does not have a notion of module scoping or lexical hiding (yet) as is found in modern programming languages and in modern versions of the Korn shell. This then imposes some additional care and awareness.
Most of the variables and functions used inside the BASH debugger start
_Dbg_
, so please don’t use variables or functions with these names in your program.
Note: there are some other variables that begin with just an underscore (
_
); over time these will be phased out. But until then, avoid those or consult what is used by the debugger. Run ‘bashdb –debugger -c “declare -p”’ to list all the variables in use including those used by the debugger.
A number of environment variables are also reserved for use; these start with
DBG_
. For example:
DBG_INPUT
,
DBG_LEVEL
and,
_Dbg_QUIT_ON_QUIT
(see section Debug),
DBG_RESTART_FILE
(see section Starting), to name a few. Finally, there are some BASH environment dynamic variables and these start with
BASH_
. For example
BASH_SUBSHELL
(see section Debug),
BASH_COMMAND
(see section Command Display),
BASH_LINENO
, and
BASH_SOURCE
to name a few.
Inside the debugger some variables may be redefined. In particular
IFS
and
PS4
, and various dollar variables
$?
,
$1
,
$2
, etc. The values before entering the debugger are saved and those variables have their old values restored when leaving the debugger. However you may notice these difference in various debugger commands. For example
examine PS4
might not return the same value as
eval declare -p PS4
. The former is picking the debugger value while the
eval
is careful to restore the value to what it was before entering the debugger.
In order to do its work The BASH debugger sets up a
DEBUG
trap. Consequently a script shouldn’t reset this or the debugger will lose control. The BASH debugger also sets up an
EXIT
handler so that it can gain control after the script finishes. Another signal intercepted is the an interrupt or
INT
signal. For more information about signal handling, see section Signals
| [ < ] | [ > ] | [ << ] | [ Up ] | [ >> ] | [Top] | [Contents] | [Index] | [ ? ] |
4. BASH Debugger Command Reference
You can abbreviate the long name of the BASH debugger command to the first few letters of the command name, if that abbreviation is unambiguous; and you can repeat the
next
or
step
commands by typing just <RET>. Some commands which require a parameter, such as
remember the argument that was given to them.
| [ < ] | [ > ] | [ << ] | [ Up ] | [ >> ] | [Top] | [Contents] | [Index] | [ ? ] |
4.1 Command syntax
A BASH debugger command is a single line of input. There is no limit on how long it can be. It starts with a command name, which is followed by arguments whose meaning depends on the command name. For example, the command
step
accepts an argument which is the number of times to step, as in ‘step 5’. You can also use the
step
command with no arguments. Some commands do not allow any arguments.
A blank line as input to the BASH debugger (typing just <RET>) means to repeat the previous next or step command.
Any text from a # to the end of the line is a comment; it does nothing. This is useful mainly in command files (see section Command files).
| [ < ] | [ > ] | [ << ] | [ Up ] | [ >> ] | [Top] | [Contents] | [Index] | [ ? ] |
4.2 Getting help (‘help’)
Once inside the BASH debugger, you can always ask it for information on its commands, using the command
help
.
-
help
-
h
- You can use
help
(abbreviated
h
) with no arguments to display a short list of named classes of commands:
bashdb<0> help Available commands: action condition edit frame load run source unalias alias continue enable handle next search step undisplay backtrace debug eval help print set step- untrace break delete examine history pwd shell step+ up clear disable export info quit show tbreak watch commands display file kill return signal trace watche complete down finish list reverse skip tty Readline command line editing (emacs/vi mode) is available. Type "help" followed by command name for full documentation. |
-
help command
- With a command name as
help
argument, the BASH debugger displays short information on how to use that command.
bashdb<0> help list
list [START|.|FN] [COUNT] -- List lines of a script.

START is the starting line or dot (.) for current line. Subsequent
list commands continue from the last line listed. If a function name
is given list the text of the function.

If COUNT is omitted, use the setting LISTSIZE. Use "set listsize" to
change this setting.

Aliases for list: l
In addition to
help
, you can use the debugger command
info
to inquire about the state of your script, or the state of the BASH debugger itself. The listings under
info
in the Index point to all the sub-commands. See section Command Index.
-
info
- This command (abbreviated
i
) is for describing the state of your program. For example, you can list the arguments given to your script with
info args
, or list the breakpoints you have set with
info breakpoints
. You can get a complete list of the
info
sub-commands with
help info
.
bashdb<0> help info
List of info subcommands:

info args -- Argument variables (e.g. $1, $2, ...) of the current stack frame.
info breakpoints -- Status of user-settable breakpoints
info display -- Show all display expressions
info files -- Source files in the program
info functions -- All function names
info line -- list current line number and and file name
info program -- Execution status of the program.
info signals -- What debugger does when program gets various signals
info source -- Information about the current source file
info stack -- Backtrace of the stack
info terminal -- Print terminal device
info variables -- All global and static variable names
info warranty -- Various kinds of warranty you do not have

Aliases for info: i
bashdb<1> info source
Current script file is parm.sh
Located in /tmp/parm.sh
Contains 34 lines.
| [ < ] | [ > ] | [ << ] | [ Up ] | [ >> ] | [Top] | [Contents] | [Index] | [ ? ] |
4.3 Quitting the BASH debugger (‘quit’, ‘kill’)
-
quit [expression]
-
quit [expression [subshell-levels]]
-
q
- To exit the BASH debugger, use the
quit
command (abbreviated
q
), or type an end-of-file character (usually C-d). If you do not supply expression, the BASH debugger will try to terminate normally or with exit code 0. Otherwise it will terminate using the result of expression as the exit code.
A simple
quit
tries to terminate all nested subshells that may be in effect. If you are nested a subshell, this is normally indicated in a debugger prompt by the number of parentheses that the history number is inside — no parenthesis means there is no subshell in effect. The dynamic variable
BASH_SUBSHELL
also contains the number of subshells in effect.
If you want only to terminate some number of subshells but not all of them, you can give a count of the number of subshells to leave after the return-code expression. To leave just one level of subshell
return
does almost the same thing. (See see section Returning) There is a subtle difference between the two though:
return
will leave you at the beginning of the next statement while
quit
may leave you at the place the subshell was invoked which may be in the middle of another command such as an assignment statement or condition test.
If the environment variable
_Dbg_QUIT_ON_QUIT
is set, when the program terminates, the debugger will also terminate too. This may be useful if you are debugging a script which calls another script and you want this inner script just to return to the outer script.
-
kill
-
k
- In situations where
quit
doesn’t work we provide an alternative and more forceful quit command:
kill
. This sends to the OS non-maskable KILL signal with the debugger process number. No cleanup of temporary files is done by the program.
| [ < ] | [ > ] | [ << ] | [ Up ] | [ >> ] | [Top] | [Contents] | [Index] | [ ? ] |
4.4 Stopping and Resuming Execution
One important use of a debugger is to stop your program before it terminates so that if your script might run into trouble, you can investigate and find out why. However should your script accidentally continue to termination, the BASH debugger has arranged for it not to leave the debugger without your explicit instruction. That way, you can restart the program using the same command arguments.
Inside the BASH debugger, your script may stop for any of several reasons, such as a signal, a breakpoint, or reaching a new line after a debugger command such as
step
. You may then examine and change variables, set new breakpoints or remove old ones, and then continue execution.
| 4.4.1 Breakpoints, watchpoints (‘break’, ‘tbreak’, ‘watch’, ‘watche’…) | Breakpoints, watchpoints (break, tbreak, watch, watche, clear) | |
| 4.4.2 Resuming Execution (‘step’, ‘next’, ‘finish’, ‘skip’, ‘continue’, ‘debug’, ‘return’) | Resuming execution (continue, step, next, skip, finish, return, debug) | |
| 4.4.3 Signals (‘handle’, ‘info handle’, ‘signal’) | Signals |
| [ < ] | [ > ] | [ << ] | [ Up ] | [ >> ] | [Top] | [Contents] | [Index] | [ ? ] |
4.4.1 Breakpoints, watchpoints (‘break’, ‘tbreak’, ‘watch’, ‘watche’…)
A breakpoint makes your script stop whenever a certain point in the program is reached. For each breakpoint, you can add conditions to control in finer detail whether your script stops.
You specify the place where your script should stop with the
break
command and its variants (see section Setting breakpoints). These commands allow own to specify the location by line number and file name or function name.
A watchpoint is a special breakpoint that stops your script when the value of an expression changes. There is a different command to set watchpoints (see section Setting watchpoints).
But aside from that, you can manage a watchpoint like any other breakpoint: you delete enable, and disable both breakpoints and watchpoints using the same commands.
You can arrange to have values from your program displayed automatically whenever BASH stops at a breakpoint. See section Automatic display.
The BASH debugger assigns a number to each breakpoint when you create it; these numbers are successive integers starting with one. In many of the commands for controlling various features of breakpoints you use the breakpoint number to say which breakpoint you want to change. Each breakpoint may be enabled or disabled; if disabled, it has no effect on your script until you enable it again.
Watchpoint numbers however are distinguished from breakpoint numbers by virtue of their being suffixed with the either an upper- or lower-case ‘W’. For example, to enable breakpoint entry 0 along with watchpoint entry 1 you would write ‘enable 1 2w’, the “2w” refers to the watchpoint; “2W” would work just as well.
| 4.4.1.1 Setting breakpoints (‘break’ ‘tbreak’) | Setting breakpoints (break, tbreak) | |
| 4.4.1.2 Setting watchpoints (‘watch’, ‘watche’) | Setting watchpoints (watch, watche) | |
| 4.4.1.3 Breakpoint command lists (‘commands’) | Breakpoint command lists (command) | |
| 4.4.1.4 Deleting breakpoints (‘clear’, ‘delete’) | Deleting breakpoints (delete, clear) | |
| 4.4.1.5 Disabling breakpoints (‘disable’, ‘enable’) | Disabling breakpoints (disable, enable) | |
| 4.4.1.6 Break conditions (‘condition’) | Break conditions (condition) |
| [ < ] | [ > ] | [ << ] | [ Up ] | [ >> ] | [Top] | [Contents] | [Index] | [ ? ] |
4.4.1.1 Setting breakpoints (‘break’ ‘tbreak’)
Breakpoints are set with the
break
command (abbreviated
b
).
-
break function
- Set a breakpoint at entry to function function.
-
break linenum
- Set a breakpoint at line linenum in the current source file. The current source file is the last file whose source text was printed. The breakpoint will stop your script just before it executes any of the code on that line.
-
break filename:linenum
- Set a breakpoint at line linenum in source file filename; filename has to be one of the files previously read in and has to be specified exactly as the name used when read in. For a list of read-in files, use the ‘info files’ command.
-
break … if cond
- Set a breakpoint with condition cond; evaluate the expression cond each time the breakpoint is reached, and stop only if the value is nonzero—that is, if cond evaluates as true. The expression is evaluated via the
let
built-in function. ‘…’ stands for one of the possible arguments described above (or no argument) specifying where to break. The word “if” is often optional and is necessary only ‘…’ is omitted. See section Break conditions, for more information on breakpoint conditions.
Examples:
bashdb<0> break fn1
Breakpoint 1 set in file parm.sh, line 3.
bashdb<1> break 28
Breakpoint 2 set in file parm.sh, line 28.
bashdb<2> break parm.sh:29
Breakpoint 3 set in file parm.sh, line 29.
bashdb<3> break 28 if x==5
Breakpoint 4 set in file parm.sh, line 28.
-
tbreak args
- Set a breakpoint enabled only for one stop. args are the same as for the
break
command, and the breakpoint is set in the same way, but the breakpoint is automatically deleted after the first time your program stops there. See section Disabling breakpoints.
-
info breakpoints [n]
-
info break [n]
-
info watchpoints [n]
- Print a table of all breakpoints, watchpoints set and not deleted, with the following columns for each breakpoint:
- Breakpoint Numbers (‘Num’)
- Enabled or Disabled (‘Enb’)
- Enabled breakpoints are marked with ‘1’. ‘0’ marks breakpoints that are disabled (not enabled).
- Count
- The number of times that breakpoint or watchpoint has been hit.
- File and Line (‘file:line’)
- The filename and line number inside that file where of breakpoint in the script. The file and line are separated with a colon.
- Condition
- A condition (an arithmetic expression) which when true causes the breakpoint to take effect.
If a breakpoint is conditional,
info break
shows the condition on the line following the affected breakpoint; breakpoint commands, if any, are listed after that.
info break
displays a count of the number of times the breakpoint has been hit.
info break
with a breakpoint number n as argument lists only that breakpoint.
Examples:
bashdb<4> info break
Breakpoints at following places:
Num Type       Disp Enb What
1   breakpoint keep y   parm.sh:3
2   breakpoint keep y   parm.sh:28
3   breakpoint keep y   parm.sh:29
4   breakpoint keep y   parm.sh:28
No watch expressions have been set.
bashdb<5> info break 4
Num Type       Disp Enb What
4   breakpoint keep y   parm.sh:28
No watch expressions have been set.
the BASH debugger allows you to set any number of breakpoints at the same place in your script. There is nothing silly or meaningless about this. When the breakpoints are conditional, this is even useful (see section Break conditions).
| [ < ] | [ > ] | [ << ] | [ Up ] | [ >> ] | [Top] | [Contents] | [Index] | [ ? ] |
4.4.1.2 Setting watchpoints (‘watch’, ‘watche’)
You can use a watchpoint to stop execution whenever the value of an expression changes, without having to predict a particular place where this may happen. As with the
(see section Examining Data), the idiosyncrasies of a BASH or any POSIX shell derivative suggest using two commands. The
watch
command is just for a single variables; the
watche
command uses the builtin “let” command to evaluate an expression. If the variable you are tracking can take a string value, issuing something like ‘watch foo’ will not have the desired effect—any string assignment to
foo
will have a value 0 when it is assigned via “let.”
-
watch var
- Set a watchpoint for a variable. the BASH debugger will break when the value of var changes. In this command do not add a leading dollar symbol to var.
-
watche expr
- Set a watchpoint for an expression via the builtin “let” command. the BASH debugger will break when expr is written into by the program and its value changes. Not that this may not work for tracking arbitrary string value changes. For that use
watch
described earlier.
| [ < ] | [ > ] | [ << ] | [ Up ] | [ >> ] | [Top] | [Contents] | [Index] | [ ? ] |
4.4.1.3 Breakpoint command lists (‘commands’)
-
commands [bnum]
-
… command-list …
-
end
- Specify a list of commands for breakpoint number bnum. The commands themselves appear on the following lines. Type a line containing just
end
to terminate the commands.
To remove all commands from a breakpoint, type
commands
and follow it immediately with
end
; that is, give no commands.
With no bnum argument,
commands
refers to the last breakpoint, watchpoint, or catchpoint set (not to the breakpoint most recently encountered).
Pressing <RET> as a means of repeating the last debugger command is disabled within a command-list.
You can use breakpoint commands to start your program up again. Simply use the
continue
command, or
step
, or any other command that resumes execution.
Any other commands in the command list, after a command that resumes execution, are ignored. This is because any time you resume execution (even with a simple
next
or
step
), you may encounter another breakpoint—which could have its own command list, leading to ambiguities about which list to execute.
If the first command you specify in a command list is
silent
, the usual message about stopping at a breakpoint is not printed. This may be desirable for breakpoints that are to print a specific message and then continue. If none of the remaining commands print anything, you see no sign that the breakpoint was reached.
silent
is meaningful only at the beginning of a breakpoint command list.
The commands
echo
,
output
, and
printf
allow you to print precisely controlled output, and are often useful in silent breakpoints.
For example, here is how you could use breakpoint commands to print the value of
x
at entry to
foo
whenever
x
is positive.
break foo if x>0 commands silent printf "x is %d\n",x cont end |
One application for breakpoint commands is to compensate for one bug so you can test for another. Put a breakpoint just after the erroneous line of code, give it a condition to detect the case in which something erroneous has been done, and give it commands to assign correct values to any variables that need them. End with the
continue
command so that your program does not stop, and start with the
silent
command so that no output is produced. Here is an example:
break 403 commands silent set x = y + 4 cont end |
| [ < ] | [ > ] | [ << ] | [ Up ] | [ >> ] | [Top] | [Contents] | [Index] | [ ? ] |
4.4.1.4 Deleting breakpoints (‘clear’, ‘delete’)
It may desirable to eliminate a breakpoint or watchpoint once it has done its job and you no longer want your script to stop there. This is called deleting the breakpoint. A breakpoint that has been deleted no longer exists; it is forgotten.
With the
clear
command you can delete breakpoints according to where they are in your script. With the
delete
command you can delete individual breakpoints, or watchpoints by specifying their breakpoint numbers. Note: as described below under the “clear” command, “d” is an alias for “clear”, not “delete”.
It is not necessary to delete a breakpoint to proceed past it. the BASH debugger automatically ignores breakpoints on the first instruction to be executed when you continue execution.
-
clear
- Delete any breakpoints at the next instruction to be executed in the selected stack frame (see section Selecting a frame). When the innermost frame is selected, this is a good way to delete a breakpoint where your script just stopped.
It may seem odd that we have an alias “d” for “clear.” It so happens that Perl’s debugger use “d” for its delete command and the delete concept in Perl’s debugger corresponds to “clear” in GDB. (Perl doesn’t have a notion of breakpoint entry numbers). So in order to be compatible with both debugger interfaces, “d” is used as an alias for “clear.” Clear?
-
clear function
-
clear filename:function
- Delete any breakpoints set at entry to the function function.
-
clear linenum
-
d linenum
- Delete any breakpoints set at or within the code of the specified line.
-
delete [breakpoints]
- Delete the breakpoints, watchpoints specified as arguments.
If no argument is specified, delete all breakpoints (the BASH debugger asks confirmation, unless you have
set confirm off
). You can abbreviate this command as
de
.
Note that for compatibility with Perl’s debugger,
d
means something else:
clear
.
| [ < ] | [ > ] | [ << ] | [ Up ] | [ >> ] | [Top] | [Contents] | [Index] | [ ? ] |
4.4.1.5 Disabling breakpoints (‘disable’, ‘enable’)
Rather than deleting a breakpoint or watchpoint, you might prefer to disable it. This makes the breakpoint inoperative as if it had been deleted, but remembers the information on the breakpoint so that you can enable it again later.
You disable and enable breakpoints, watchpoints, and catchpoints with the
enable
and
disable
commands, optionally specifying one or more breakpoint numbers as arguments. Use
info break
or
info watch
to print a list of breakpoints, watchpoints, and catchpoints if you do not know which numbers to use.
A breakpoint, watchpoint, or catchpoint can have any of four different states of enablement:
- Enabled. The breakpoint stops your program. A breakpoint set with the
break
command starts out in this state.
- Disabled. The breakpoint has no effect on your program.
- Enabled once. The breakpoint stops your program, but then becomes disabled.
- Enabled for deletion. The breakpoint stops your program, but immediately after it does so it is deleted permanently. A breakpoint set with the
tbreak
command starts out in this state.
You can use the following commands to enable or disable breakpoints, watchpoints, and catchpoints:
-
disable [breakpoints]
- Disable the specified breakpoints—or all breakpoints, if none are listed. A disabled breakpoint has no effect but is not forgotten. All options such as ignore-counts, conditions and commands are remembered in case the breakpoint is enabled again later. You may abbreviate
disable
as
dis
.
-
enable [breakpoints]
- Enable the specified breakpoints (or all defined breakpoints). They become effective once again in stopping your program.
Except for a breakpoint set with
tbreak
(see section Setting breakpoints), breakpoints that you set are initially enabled; subsequently, they become disabled or enabled only when you use one of the commands above. (The command
until
can set and delete a breakpoint of its own, but it does not change the state of your other breakpoints; see Resuming Execution.)
| [ < ] | [ > ] | [ << ] | [ Up ] | [ >> ] | [Top] | [Contents] | [Index] | [ ? ] |
4.4.1.6 Break conditions (‘condition’)
The simplest sort of breakpoint breaks every time your script reaches a specified place. You can also specify a condition for a breakpoint. A condition is just a BASH expression.
Break conditions can be specified when a breakpoint is set, by using ‘if’ in the arguments to the
break
command. See section Setting breakpoints. A breakpoint with a condition evaluates the expression each time your script reaches it, and your script stops only if the condition is true. They can also be changed at any time with the
condition
command.
There is also a notion of a “one-time” breakpoint which gets deleted as soon as it is hit, so that that breakpoint is executed once only.
Conditions are also accepted for watchpoints; you may not need them, since a watchpoint is inspecting the value of an expression anyhow—but it might be simpler, say, to just set a watchpoint on a variable name, and specify a condition that tests whether the new value is an interesting one.
-
condition bnum expression
- Specify expression as the break condition for breakpoint bnum. After you set a condition, breakpoint bnum stops your program only if the value of expression is true (nonzero).
-
condition bnum
- Remove the condition from breakpoint number bnum. It becomes an ordinary unconditional breakpoint.
BASH does not actually evaluate expression at the time the
condition
command (or a command that sets a breakpoint with a condition, like
break if …
) is given, however.
Examples;
condition 1 x>5 # Stop on breakpoint 0 only if x>5 is true. condition 1 # Change that! Unconditinally stop on breakpoint 1. |
| [ < ] | [ > ] | [ << ] | [ Up ] | [ >> ] | [Top] | [Contents] | [Index] | [ ? ] |
4.4.2 Resuming Execution (‘step’, ‘next’, ‘finish’, ‘skip’, ‘continue’, ‘debug’, ‘return’)
A typical technique for using stepping is to set a breakpoint (see section Breakpoints; watchpoints) at the beginning of the function or the section of your script where a problem is believed to lie, run your script until it stops at that breakpoint, and then step through the suspect area, examining the variables that are interesting, until you see the problem happen.
Continuing means resuming program execution until your script completes normally. In contrast, stepping means executing just one more “step” of your script, where “step” may mean either one line of source code. Either when continuing or when stepping, your script may stop even sooner, due to a breakpoint or a signal.
| 4.4.2.1 Step (‘step’) | running the next statement (step) | |
| 4.4.2.2 Next (‘next’) | running the next statement skipping over functions (next) | |
| 4.4.2.3 Finish (‘finish’) | running until the return of a function or “source” (finish) | |
| 4.4.2.4 Skip (‘skip’) | skipping the next statement (skip) | |
| 4.4.2.5 Continue (‘continue’) | continuing execution (continue) | |
| 4.4.2.6 Debug (‘debug’) | debugging into another program (debug) | |
| 4.4.2.7 Returning from a function, sourced file, or subshell (‘return’) | returning |
| [ < ] | [ > ] | [ << ] | [ Up ] | [ >> ] | [Top] | [Contents] | [Index] | [ ? ] |
4.4.2.1 Step (‘step’)
-
step[+|-] [count]
- Continue running your script until control reaches a different source line, then stop it and return control to the BASH debugger. An default alias alias for this is
s
.
The
step
command only stops at the first instruction of a source line. This prevents the multiple stops that could otherwise occur in
switch
statements,
for
loops, etc.
step
continues to stop if a function that has debugging information is called within the line. In other words,
step
steps inside any functions called within the line.
Sometimes you want to step ensure that the next line is different from the one you currently are on. To do this, add the
+
suffix. And if you find you want to do this all of the time there is a setting
force
that will have this be the default behavior. On the other hand if you want to be explicit about not having this behavior even when
force
is in effect add the
-
suffix.
With a count, continue running as in
step
, but do so count times. If a breakpoint is reached, or a signal not related to stepping occurs before count steps, stepping stops right away.
| [ < ] | [ > ] | [ << ] | [ Up ] | [ >> ] | [Top] | [Contents] | [Index] | [ ? ] |
4.4.2.2 Next (‘next’)
-
next [count]
- Continue to the next source line in the current (innermost) stack frame. This is similar to
step
, but function calls that appear within the line of code are executed without stopping. Execution stops when control reaches a different line of code at the original stack level that was executing when you gave the
next
command. This command is abbreviated
n
.
An argument count is a repeat count, as for
step
.
| [ < ] | [ > ] | [ << ] | [ Up ] | [ >> ] | [Top] | [Contents] | [Index] | [ ? ] |
4.4.2.3 Finish (‘finish’)
-
finish
- Continue running until just after function returns. Currently, the line shown on a return is the function header, unless the
return
builtin function is executed in which case it is the line number of the
return
function.
Contrast this with the
return
command (see section Returning from a function) and the
quit
(see section Quitting the BASH debugger).
| [ < ] | [ > ] | [ << ] | [ Up ] | [ >> ] | [Top] | [Contents] | [Index] | [ ? ] |
4.4.2.4 Skip (‘skip’)
-
skip [count]
- Skip execution of the next source line. This may be useful if you have an action that “fixes” existing code in the script. The
debug
command internally uses the
skip
command to skip over existing non-debugged invocation that was presumably just run.
| [ < ] | [ > ] | [ << ] | [ Up ] | [ >> ] | [Top] | [Contents] | [Index] | [ ? ] |
4.4.2.5 Continue (‘continue’)
-
continue [- | line-specification]
-
c [line-specification]
- Resume program execution, at the address where your script last stopped; any breakpoints set at that address are bypassed.
The optional argument line-specification allows you to specify a location (a line number, function, or filename linenumber combination) to set a one-time breakpoint which is deleted when that breakpoint is reached. Should the program stop before that breakpoint is reached, in a listing of the breakpoints you will see this entry with the condition 9999 which indicates a one-time breakpoint.
If instead of a line specification you enter
-
, debugging will be turned of after continuing causing the program to run at full speed.
To resume execution at a different place, you can use
return
(see section Returning from a function) to go back to the calling function or sourced script. If you are nested inside a subshell,
quit
with a value for the number of subshells to exit also functions like a return.
| [ < ] | [ > ] | [ << ] | [ Up ] | [ >> ] | [Top] | [Contents] | [Index] | [ ? ] |
4.4.2.6 Debug (‘debug’)
-
debug [script-name]
- Debug into script-name. If no name is given the current source line is used. In either case the options are prepended to cause the debugger to run.
The nesting level of the debugger is saved inside environment variable
_Dbg_DEBUGGER_LEVEL
. The debugger prompt indicates the level of nesting by enclosing the history in that many nestings of
<>
symbols.
| [ < ] | [ > ] | [ << ] | [ Up ] | [ >> ] | [Top] | [Contents] | [Index] | [ ? ] |
4.4.2.7 Returning from a function, sourced file, or subshell (‘return’)
The
return
command does not resume execution; it leaves the program stopped in the state that would exist if the function had just returned. See also the
quit
command (Quitting the BASH debugger). In some situations
return
is similar to
quit
: in particular when the script is not currently inside in a function and the number of subshells in effect is 0, or when a subshell count of 1 is given on the
quit
command.
In contrast, the
finish
command (see section Finish) resumes execution until the selected stack frame returns naturally.
| [ < ] | [ > ] | [ << ] | [ Up ] | [ >> ] | [Top] | [Contents] | [Index] | [ ? ] |
4.4.3 Signals (‘handle’, ‘info handle’, ‘signal’)
| 4.4.3.1 Intercepting Signals (‘handle’, ‘info handle’) | Specify which signals to handle and show what’s been set | |
| 4.4.3.2 Sending your program a signal (‘signal’) | Send a signal to your program |
A signal is an asynchronous event that can happen in a program. The operating system defines the possible kinds of signals, and gives each kind a name and a number. For example, in Unix
SIGINT
is the signal a program gets when you type an interrupt character (often C-c);
SIGALRM
occurs when the alarm clock timer goes off (which happens only if your program has requested an alarm).
Some signal handlers are installed and changed for the BASH debugger’s normal use:
SIGDEBUG
and
SIGEXIT
.
SIGDEBUG
is used by the debugger to potentially stop your program before execution of each statement occurs, and
SIGEXIT
is used to catch your program just before it is set to leave so you have the option of restarting the program with the same options (and not leave the debugger) or let the program quit.
Signal handlers that the debugged script might have installed are saved and called before the corresponding debugger handler. Thus, the debugged program should work roughly in the same fashion as when it is not debugged. However there are some call-stack variables which inevitably will differ. To try to hedge this a little so the behavior is the same, the BASH debugger will modify arguments to the traps if it finds one of the call-stack that change as a result of the debugger being in place. In particular
$LINENO
will get replaced with
${BASH_LINENO[0]}
; also
${BASH_LINENO[0]}
and
${BASH_SOURCE[0]}
get replaced with
${BASH_LINENO[1]}
and
${BASH_SOURCE[1]}
respectively.
The debugger also installs an interrupt handler
SIGINT
so that errant programs can be interrupted and you can find out where the program was when you interrupted it.
Some signals, including
SIGALRM
, are a normal part of the functioning of your program. Others, such as
SIGSEGV
, indicate errors; these signals are fatal (they kill your program immediately) if the program has not specified in advance some other way to handle the signal.
SIGINT
does not indicate an error in your program, but it is normally fatal so it can carry out the purpose of the interrupt: to kill the program.
BASH has the ability to detect any occurrence of a signal in your program. You can tell BASH in advance what to do for each kind of signal.
Normally, BASH is set up to let the non-erroneous signals like
SIGALRM
be silently passed to your program (so as not to interfere with their role in the program’s functioning) but to stop your program immediately whenever an error signal happens. You can change these settings with the
handle
command.
| [ < ] | [ > ] | [ << ] | [ Up ] | [ >> ] | [Top] | [Contents] | [Index] | [ ? ] |
4.4.3.1 Intercepting Signals (‘handle’, ‘info handle’)
-
handle signal keywords…
- Change the way BASH handles signal signal. signal can be the number of a signal or its name (with or without the ‘SIG’ at the beginning). The keywords say what change to make.
-
info signals
-
info handle
- Print a table of all the kinds of signals and how BASH has been told to handle each one. You can use this to see the signal numbers of all the defined types of signals.
info handle
is an alias for
info signals
.
The keywords allowed by the
handle
command can be abbreviated. Their full names are:
-
stop
- BASH should stop your program when this signal happens. This implies the
print
keyword as well.
-
nostop
- BASH should not stop your program when this signal happens. It may still print a message telling you that the signal has come in.
-
print
- BASH should print a message when this signal happens.
-
noprint
- BASH should not mention the occurrence of the signal at all.
-
stack
- BASH should print a stack trace when this signal happens.
-
nostack
- BASH should not print a stack trace when this signal occurs.
| [ < ] | [ > ] | [ << ] | [ Up ] | [ >> ] | [Top] | [Contents] | [Index] | [ ? ] |
4.4.3.2 Sending your program a signal (‘signal’)
-
signal signal-name | signal-number - You can use the
signal
command send a signal to your program. Supply either the signal name, e.g.
SIGINT
, or the signal number
15
.
| [ < ] | [ > ] | [ << ] | [ Up ] | [ >> ] | [Top] | [Contents] | [Index] | [ ? ] |
4.5 Examining the Stack Frame (‘where’, ‘frame’, ‘up’, ‘down’)
When your script has stopped, one thing you’ll probably want to know is where it stopped and some idea of how it got there.
Each time your script performs a function call (either as part of a command substitution or not), or ‘source’s a file, information about this action is saved. The call stack then is this a history of the calls that got you to the point that you are currently stopped at.
One of the stack frames is selected by the BASH debugger and many the BASH debugger commands refer implicitly to the selected frame. In particular, whenever you ask the BASH debugger to list lines without giving a line number or location the value is found in the selected frame. There are special the BASH debugger commands to select whichever frame you are interested in. See section Selecting a frame.
When your program stops, BASH automatically selects the currently executing frame and describes it briefly, similar to the
frame
command.
| 4.5.1 Stack frames | ||
| 4.5.2 Backtraces (‘where’) | Backtraces (where) | |
| 4.5.3 Selecting a frame (‘up’, ‘down’, ‘frame’) | Selecting a frame (up, down, frame) | |
| [ < ] | [ > ] | [ << ] | [ Up ] | [ >> ] | [Top] | [Contents] | [Index] | [ ? ] |
4.5.1 Stack frames
The call stack is divided up into contiguous pieces called stack frames, or frames for short; each frame is the data associated with one call to one function. The frame contains the line number of the caller of the function, the source-file name that the line refers to a function name (which could be the built-in name “source”)..
When your script is started, the stack has only one frame, that of the function
main
. This is called the initial frame or the outermost frame. Each time a function is called, a new frame is made. Each time a function returns, the frame for that function invocation is eliminated. If a function is recursive, there can be many frames for the same function. The frame for the function in which execution is actually occurring is called the innermost frame. This is the most recently created of all the stack frames that still exist.
the BASH debugger assigns numbers to all existing stack frames, starting with zero for the innermost frame, one for the frame that called it, and so on upward. These numbers do not really exist in your script; they are assigned by the BASH debugger to give you a way of designating stack frames in the BASH debugger commands.
| [ < ] | [ > ] | [ << ] | [ Up ] | [ >> ] | [Top] | [Contents] | [Index] | [ ? ] |
4.5.2 Backtraces (‘where’)
A backtrace is essentially the same as the call stack: a summary of how your script got where it is. It shows one line per frame, for many frames, starting with the place that you are stopped at (frame zero), followed by its caller (frame one), and on up the stack.
-
backtrace
-
bt
-
where
-
T
- Print a backtrace of the entire stack: one line per frame for all frames in the stack.
-
backtrace n
-
bt n
-
where n
-
T n
- Similar, but print only the innermost n frames.
The names
where
and
T
are additional aliases for
backtrace
.
Each line in the backtrace shows the frame number and the function name, the source file name and line number, as well as the function name.
Here is an example of a backtrace taken a program in the regression-tests ‘parm.sh’.
% ../bashdb -n -L .. parm.sh
Bourne-Again Shell Debugger, release 4.4-1.0.2git
Copyright 2002, 2003, 2004, 2006, 2007, 2008, 2009, 2011 Rocky Bernstein
This is free software, covered by the GNU General Public License, and you are
welcome to change it and/or distribute copies of it under certain conditions.

(./parm.sh:21):
21:	fn1 5
bashdb<0> continue fn3
One-time breakpoint 1 set in file ./parm.sh, line 17.
fn2: testing 1 2 3
(./parm.sh:17):
17:	fn3() {
bashdb<1> where
->0 in file `./parm.sh' at line 14
##1 fn3() called from file `./parm.sh' at line 14
##2 fn2("testing 1", "2 3") called from file `parm.sh' at line 5
##3 fn1("0") called from file `parm.sh' at line 9
##4 fn1("1") called from file `parm.sh' at line 9
##5 fn1("2") called from file `parm.sh' at line 9
##6 fn1("3") called from file `parm.sh' at line 9
##7 fn1("4") called from file `parm.sh' at line 9
##8 fn1("5") called from file `parm.sh' at line 21
##9 source("parm.sh") called from file `bashdb' at line 143
##10 main("-n", "-L", "..", "parm.sh") called from file `bashdb' at line 0
|
The display for “frame” zero isn’t a frame at all, although it has the same information minus a function name; it just indicates that your script has stopped at the code for line
14
of
./parm.sh
.
| [ < ] | [ > ] | [ << ] | [ Up ] | [ >> ] | [Top] | [Contents] | [Index] | [ ? ] |
4.5.3 Selecting a frame (‘up’, ‘down’, ‘frame’)
Commands for listing source code in your script work on whichever stack frame is selected at the moment. Here are the commands for selecting a stack frame; all of them finish by printing a brief description of the stack frame just selected.
-
up [n]
- Move n frames up the stack. For positive numbers n, this advances toward the outermost frame, to higher frame numbers, to frames that have existed longer. Using a negative n is the same as issuing a
down
command of the absolute value of the n. Using zero for n does no frame adjustment, but since the current position is redisplayed, it may trigger a resynchronization if there is a front end also watching over things.
n defaults to one. You may abbreviate
up
as
u
.
-
down [n]
- Move n frames down the stack. For positive numbers n, this advances toward the innermost frame, to lower frame numbers, to frames that were created more recently. Using a negative n is the same as issuing a
up
command of the absolute value of the n. Using zero for n does no frame adjustment, but since the current position is redisplayed, it may trigger a resynchronization if there is a front end also watching over things.
n defaults to one. You may abbreviate
down
as
do
.
All of these commands end by printing two lines of output describing the frame. The first line shows the frame number, the function name, the arguments, and the source file and line number of execution in that frame. The second line shows the text of that source line.
For example:
bashdb<8> up 19: sourced_fn bashdb<8> T ##0 in file `./bashtest-sourced' at line 8 ->1 sourced_fn() called from file `bashtest-sourced' at line 19 ##2 source() called from file `bashdb-test1' at line 23 ##3 fn2() called from file `bashdb-test1' at line 33 ##4 fn1() called from file `bashdb-test1' at line 42 ##5 main() called from file `bashdb-test1' at line 0 |
After such a printout, the
list
command with no arguments prints ten lines centered on the point of execution in the frame. See section Printing source lines.
-
frame args
- The
frame
command allows you to move from one stack frame to another, and to print the stack frame you select. args is the the stack frame number;
frame 0
then will always show the current and most recent stack frame.
If a negative number is given, counting is from the other end of the stack frame, so
frame -1
shows the least-recent, outermost or most “main” stack frame.
Without an argument,
frame
prints the current stack frame. Since the current position is redisplayed, it may trigger a resynchronization if there is a front end also watching over things.
| [ < ] | [ > ] | [ << ] | [ Up ] | [ >> ] | [Top] | [Contents] | [Index] | [ ? ] |
4.6 Examining Source Files (‘list’)
the BASH debugger can print parts of your script’s source. When your script stops, the BASH debugger spontaneously prints the line where it stopped. Likewise, when you select a stack frame (see section Selecting a frame), the BASH debugger prints the line where execution in that frame has stopped. You can print other portions of source files by explicit command.
If you use the BASH debugger through its GNU Emacs interface, you may prefer to use Emacs facilities to view source.
To print lines from a source file, use the
list
command (abbreviated
l
). By default, ten lines are printed. There are several ways to specify what part of the file you want to print.
Here are the forms of the
list
command most commonly used:
-
list linenum
-
l linenum
- Print lines centered around line number linenum in the current source file.
-
list function
-
l function
- Print the text of function.
-
list
-
l
- Print more lines. If the last lines printed were printed with a
list
command, this prints lines following the last lines printed; however, if the last line printed was a solitary line printed as part of displaying a stack frame (see section Examining the Stack), this prints lines centered around that line.
-
list -
-
l -
- Print lines just before the lines last printed.
By default, the BASH debugger prints ten source lines with any of these forms of the
list
command. You can change this using
set listsize
:
-
set listsize count
- Make the
list
command display count source lines (unless the
list
argument explicitly specifies some other number).
-
show listsize
- Display the number of lines that
list
prints.
Repeating a
list
command with <RET> discards the argument, so it is equivalent to typing just
list
. This is more useful than listing the same lines again. An exception is made for an argument of ‘–’; that argument is preserved in repetition so that each repetition moves up in the source file.
In general, the
list
command expects you to supply a linespecs. Linespecs specify source lines; there are several ways of writing them, but the effect is always to specify some source line.
Here is a complete description of the possible arguments for
list
:
-
list linespec
- Print lines centered around the line specified by linespec.
-
list first increment
- Print increment lines starting from first
-
list first
- Print lines starting with first.
-
list -
- Print lines just before the lines last printed.
-
list .
- Print lines after where the script is stopped.
-
list
- As described in the preceding table.
Here are the ways of specifying a single source line—all the kinds of linespec.
-
number
- Specifies line number of the current source file. When a
list
command has two linespecs, this refers to the same source file as the first linespec.
-
filename:number
- Specifies line number in the source file filename.
-
function
- Specifies the line that function function is listed on.
| [ < ] | [ > ] | [ << ] | [ Up ] | [ >> ] | [Top] | [Contents] | [Index] | [ ? ] |
4.7 Editing Source files (‘edit’)
To edit the lines in a source file, use the
edit
command. The editing program of your choice is invoked with the current line set to the active line in the program. Alternatively, you can give a line specification to specify what part of the file you want to print if you want to see other parts of the program.
You can customize to use any editor you want by using the
EDITOR
environment variable. The only restriction is that your editor (say
ex
), recognizes the following command-line syntax:
ex +number file |
The optional numeric value +number specifies the number of the line in the file where to start editing. For example, to configure the BASH debugger to use the
vi
editor, you could use these commands with the
sh
shell:
EDITOR=/usr/bin/vi export EDITOR gdb … |
or in the
csh
shell,
setenv EDITOR /usr/bin/vi gdb … |
-
edit [line specification]
- Edit line specification using the editor specified by the
EDITOR
environment variable.
| [ < ] | [ > ] | [ << ] | [ Up ] | [ >> ] | [Top] | [Contents] | [Index] | [ ? ] |
4.8 Searching source files (‘search’, ‘reverse’, ‘/…/’, ‘?..?’)
There are two commands for searching through the current source file for a BASH extended pattern-matching expression.
-
forward bash-pattern
-
search bash-pattern
- The command ‘forward bash-pattern’ checks each line, starting with the one following the current line, for a match for bash-pattern which is an extended bash pattern-matching expression. It lists the line that is found. You can use the synonym ‘search bash-pattern’ or abbreviate the command name as
fo
or
/pat/
.
-
reverse bash-pattern
- The command ‘reverse bash-pattern’ checks each line, starting with the one before the last line listed and going backward, for a match for bash-pattern. It lists the line that is found. You can abbreviate this command as
rev
or
?bash-pattern?
.
| [ < ] | [ > ] | [ << ] | [ Up ] | [ >> ] | [Top] | [Contents] | [Index] | [ ? ] |
4.9 Examining Data (‘print’, ‘examine’, ‘info variables’)
One way to examine string data in your script is with the
command (abbreviated
p
). However a more versatile print command is
x
; it can print variable and function definitions and can do arithmetic computations. Finally, the most general method would be via
eval echo
.
-
print expr
- Use
print
to display strings as you would from
echo
. And as such, variable names to be substituted have to be preceded with a dollar sign. As with echo, filename expansion, e.g. tilde expansion, is performed on unquoted strings. So for example if you want to print a *, you would write ‘print “*”’, not ‘print *’. If you want to have the special characters dollars sign appear, use a backslash.
bashdb<0> print the value of x is $x
the value of x is 22
bashdb<1> p The home directory for root is ~root
The home directory for root is /root
bashdb<2> p '*** You may have won $$$ ***'
*** You may have won $$$ ***
bashdb<3> # Note the use of the single quotes.
bashdb<3> # Compare what happens with double quotes or no quotes
-
print
-
p
- If you omit expr, the BASH debugger displays the last expression again.
-
x variable1 [variable2...]
-
x expr
- This is a smarter, more versatile “print” command, and although sometimes it might not be what you want, and you may want to resort to either
print
or
eval echo...
.
As with
print
, if you omit expr, the BASH debugger displays the last expression again.
The
x
command first checks if expr is variable or a list of variables delimited by spaces. If it is, the definition(s) and value(s) of each printed via BASH’s
declare -p
command. This will show the variable’s attributes such as if it is read only or if it is an integer. If the variable is an array, that is show and the array values are printed.
If instead expr is a function, the function definition is printed via BASH’s
declare -f
command. If expr was neither a variable nor an expression, then we try to get a value via
let
. And if this returns an error, as a last resort we call
print
and give what it outputs.
Since
let
may be used internally and since (to my thinking)
let
does funny things, the results may seem odd unless you understand the sequence tried above and how
let
works. For “example if the variable
foo
has value 5, then ‘x foo’ shows the definition of foo with value 5, and ‘x foo+5’ prints 10 as expected. So far so good. However if
foo
is has the value ‘alpha’, ‘x foo+5’ prints 5 because
let
has converted the string ‘alpha’ into the numeric value 0. So ‘p foo+5’ will simply print “foo+5”; if you want the value of “foo” substituted inside a string, for example you expect “the value of foo is $foo” to come out “the value of foo is 5”, then the right command to use is
print
rather than
x
, making sure you add the dollar onto the beginning of the variable.
bashdb<0> examine x y declare -- x="22" declare -- y="23" bashdb<1> examine x+y 45 bashdb<2> x fn1 fn1 () { echo "fn1 here"; x=5; fn3 } bashdb<2> x FUNCNAME declare -a FUNCNAME='([0]="_Dbg_cmd_x" [1]="_Dbg_cmdloop" [2]="_Dbg_debug_trap_handler" [3]="main")' -
V [!][pattern]
- If you want to all list variables and values or a set of variables by pattern, use this command.
bashdb<0> V dq*
dq_args="dq_*"
dq_cmd="V"
bashdb<1> V FUNCNAME
FUNCNAME='([0]="_Dbg_cmd_list_variables" [1]="_Dbg_cmdloop" [2]="_Dbg_debug_trap_handler" [3]="main")'
| [ < ] | [ > ] | [ << ] | [ Up ] | [ >> ] | [Top] | [Contents] | [Index] | [ ? ] |
4.10 Automatic display (‘display’, ‘undisplay’)
If you find that you want to print the value of an expression frequently (to see how it changes), you might want to add it to the automatic display list so that the BASH debugger evaluates a statement each time your program stops. Each expression added to the list is given a number to identify it; to remove an expression from the list, you specify that number. The automatic display looks like this:
2 (echo $x): 38 |
This display shows item numbers, expressions and their current values.
-
display expr
- Add the expression expr to the list of expressions to display each time your program stops.
-
display
- Display the current values of the expressions on the list, just as is done when your program stops.
-
undisplay dnums…
-
delete display dnums…
- Remove item numbers dnums from the list of expressions to display.
undisplay
does not repeat if you press <RET> after using it. (Otherwise you would just get the error ‘No display number …’.)
-
disable display dnums…
- Disable the display of item numbers dnums. A disabled display item is not printed automatically, but is not forgotten. It may be enabled again later.
-
enable display dnums…
- Enable display of item numbers dnums. It becomes effective once again in auto display of its expression, until you specify otherwise.
-
info display
- Print the list of expressions previously set up to display automatically, each one with its item number, but without showing the values. This includes disabled expressions, which are marked as such. It also includes expressions which would not be displayed right now because they refer to automatic variables not currently available.
| [ < ] | [ > ] | [ << ] | [ Up ] | [ >> ] | [Top] | [Contents] | [Index] | [ ? ] |
4.11 Running Arbitrary BASH and Shell commands (‘eval’, ‘shell’)
The two most general commands and most “low-level” are
eval
and
shell
.
-
eval [ bash-code ]
-
e
- In contrast to the commands of the last section the most general way to examine data is through
eval
. But you do much more with this; you can change the values of variables, since, you are just evaluating BASH code.
If you expect output, you should arrange that in the command, such as via
echo
or
printf
. For example, to print the value of foo, you would type ‘e echo $foo’. This is bit longer than ‘p $foo’ or (when possible) ‘x foo’. However suppose you wanted to find out how the builtin test operator ‘[’ works with the ‘-z’ test condition. You could use
eval
to do this such as ‘e [ -z “$foo”] && echo “yes”’.
-
eval
- I find I sometimes want to run the line that’s about to be executed to see if I want to step into methods that are called.
For example:
(/etc/apparmor/functions:24):
PROFILES="/etc/apparmor.d"
bashdb<2>
I had been cutting and pasting the command as shown, but realized I could do better if I made a command for this. So that’s what I’ve done.
If you run the ‘eval’ command without any arguments, it will run the command that is about to be run.
(/etc/apparmor/functions:24):
PROFILES="/etc/apparmor.d"
bashdb<2> eval
eval: PROFILES="/etc/apparmor.d"
$? is 0
bashdb<3>
This was working fine, until I started coming across tests inside
if
,
elsif
,
case
,
return
or
while
blocks. For example:
(/etc/init.d/apparmor:70):
if [ "$1" = "recache" ]
Suppose I want to know which branch I’m going to take before taking the branch. That way I might even be able to change which way to go by changing the test before it runs in the debugged program. (In the above example, I could print $1
bashdb<2> pr $1
status
But I’m lazy. I’d rather let the debugger do the work for me:
bashdb<1> eval?
eval: [ "$1" = "recache" ]
$? is 1
If you alias eval with a name that ends in ? it will strip off any leading
if
,
case
,
while
,
elsif
, or
return
.
-
!! command string
- If you need to execute occasional shell commands during your debugging session, there is no need to leave or suspend the BASH debugger; you can just use the
shell
command or its alias
!!
.
Invoke a shell to execute command string.
-
shell
- Although the debugger allows one to evaluate arbitrary BASH code using
eval
, or via the
set autoeval
mode, sometimes you might prefer to work inside a BASH shell to see variables, experiment, issue commands (using the currently-set up environment), and even change variables and functions.
For this we, the debugger
shell
command, enters a nested shell session. But before it does this, it saves out variable and function definitions in the current context of the running program. That way, you have access to those.
This however creates a new problem: getting changes you make reflected back into the running program. Right now any variable you change can be flagged to have its value re-read when the shell exits. This is done using the
save_var
function inside the nested shell.
save_var
takes a list of variable names.
Here is an example session
bashdb /etc/init.d/apparmor status
bashdb debugger, release 4.2-0.8

Copyright 2002, 2003, 2004, 2006, 2007, 2008, 2009, 2010, 2011 Rocky Bernstein
This is free software, covered by the GNU General Public License, and you are
welcome to change it and/or distribute copies of it under certain conditions.
...
(/etc/init.d/apparmor:35):
. /etc/apparmor/functions
bashdb<1> s
(/etc/apparmor/functions:24):
PROFILES="/etc/apparmor.d"
bashdb<2> s
(/etc/apparmor/functions:25):
PARSER="/sbin/apparmor_parser"
bashdb<3> shell
bashdb $ typeset -p PROFILES
typeset -p PROFILES
typeset PROFILES=/etc/apparmor.d
bashdb $ PROFILES='Hi, Mom!'
bashdb $ save_vars PROFILES
bashdb $  <EOF>
(/etc/apparmor/functions:25):
PARSER="/sbin/apparmor_parser"
bashdb<4> x PROFILES
typeset PROFILES='Hi, Mom!'
Note that inside the nested shell the we have set the prompt has been set to
bashdb $
.
| [ < ] | [ > ] | [ << ] | [ Up ] | [ >> ] | [Top] | [Contents] | [Index] | [ ? ] |
4.12 Interfacing to the OS (‘cd’, ‘pwd’)
-
cd
- Set working directory to directory for debugger and program being debugged. Tilde expansion, variable and filename expansion is performed on directory. If no directory is given, we print out the current directory which is really the same things as running
pwd
.
Note that
gdb
is a little different in that it performs tilde expansion but not filename or variable expansion and the directory argument is not optional as it is here.
-
pwd
- Prints the working directory as the program sees things.
| [ < ] | [ > ] | [ << ] | [ Up ] | [ >> ] | [Top] | [Contents] | [Index] | [ ? ] |
4.13 Status and Debugger Settings (‘info’, ‘show’)
| 4.13.1 Showing information about the program being debugged (‘info’) | Showing information about the program being debugged | |
| 4.13.2 Show information about the debugger (‘show’) | Show information about the debugger |
In addition to
help
, you can use the BASH commands
info
and
show
to inquire about the state of your program, or the state of BASH itself. Each command supports many topics of inquiry; here we introduce each of them in the appropriate context. The listings under
info
and under
show
in the Index point to all the sub-commands. See section Command Index.
| [ < ] | [ > ] | [ << ] | [ Up ] | [ >> ] | [Top] | [Contents] | [Index] | [ ? ] |
4.13.1 Showing information about the program being debugged (‘info’)
This
info
command (abbreviated
i
) is for describing the state of your program. For example, you can list the current
$1
,
$2
parameters with
info args
, or list the breakpoints you have set with
info breakpoints
or
info watchpoints
. You can get a complete list of the
info
sub-commands with
help
info
.
-
info args
- Argument variables (e.g. $1, $2, …) of the current stack frame.
-
info breakpoints
- Status of user-settable breakpoints
-
info display
- Show all display expressions
-
info files
- Source files in the program
-
info functions
- All function names
-
info line
- list current line number and and file name
-
info program
- Execution status of the program.
-
info signals
- What debugger does when program gets various signals
-
info source
- Information about the current source file
-
info stack
- Backtrace of the stack
-
info terminal
- Print terminal device
-
info variables
- All global and static variable names
| [ < ] | [ > ] | [ << ] | [ Up ] | [ >> ] | [Top] | [Contents] | [Index] | [ ? ] |
4.13.2 Show information about the debugger (‘show’)
In contrast to
info
,
show
is for describing the state of BASH itself. You can change most of the things you can
show
, by using the related command
set
;
The distinction between
info
and
show
however is a bit fuzzy and is kept here to try to follow the GDB interface. For example, to list the arguments given to your script use
show args
;
info args
does something different.
Here are three miscellaneous
show
subcommands, all of which are exceptional in lacking corresponding
set
commands:
-
show version
- Show what version of BASH is running. You should include this information in BASH bug-reports. If multiple versions of BASH are in use at your site, you may need to determine which version of BASH you are running; as BASH evolves, new commands are introduced, and old ones may wither away. Also, many system vendors ship variant versions of BASH, and there are variant versions of BASH in GNU/Linux distributions as well. The version number is the same as the one announced when you start BASH.
-
show copying
- Display information about permission for copying BASH.
-
show linetrace
- Show if line tracing is enabled. See also Show position information as statements are executed (‘set linetrace’).
-
show logging
- Show summary information of logging variables which can be set via
set logging
. See also Logging output (‘set logging’, ‘set logging file’…).
-
show logging file
- Show the current logging file.
-
show logging overwrite
- Show whether logging overwrites or appends to the log file.
-
show warranty
- Display the GNU “NO WARRANTY” statement, or a warranty, if your version of the BASH debugger comes with one.
| [ < ] | [ > ] | [ << ] | [ Up ] | [ >> ] | [Top] | [Contents] | [Index] | [ ? ] |
4.14 Controlling bashdb (‘set’, ‘file’, ‘prompt’, ‘history’…)
You can alter the way BASH interacts with you in various ways given below.
| [ < ] | [ > ] | [ << ] | [ Up ] | [ >> ] | [Top] | [Contents] | [Index] | [ ? ] |
4.14.1 Debugger Command Aliases (‘alias’)
| [ < ] | [ > ] | [ << ] | [ Up ] | [ >> ] | [Top] | [Contents] | [Index] | [ ? ] |
4.14.2 Annotation Level (‘set annotate’)
-
set annotate integer
- The annotation level controls how much information the BASH debugger prints in its prompt; right new it just controls whether we show full filenames in output or the base part of the filename without path information. Level 0 is the normal, level 1 is for use when the BASH debugger is run as a subprocess of GNU Emacs of DDD, level 2 is the maximum annotation suitable for programs that control the BASH debugger.
| [ < ] | [ > ] | [ << ] | [ Up ] | [ >> ] | [Top] | [Contents] | [Index] | [ ? ] |
4.14.3 Set/Show auto-eval (‘set autoeval’)
-
set autoeval [ on | 1 | off | 0 ]
- Specify that debugger input that isn’t recognized as a command should be passed to Ruby for evaluation (using the current debugged program namespace). Note however that we first check input to see if it is a debugger command and only if it is not do we consider it as Ruby code. This means for example that if you have variable called
n
and you want to see its value, you could use
p n
, because just entering
n
will be interpreted as the debugger “next” command.
When autoeval is set on, you’ll get a different error message when you invalid commands are encountered. Here’s a session fragment to show the difference
bashdb<1> stepp
Unknown command
bashdb<2> set autoeval on
autoeval is on.
bashdb<3> stepp
NameError Exception: undefined local variable or method `stepp' for ...
-
show args
- Shows whether Ruby evaluation of debugger input should occur or not.
| [ < ] | [ > ] | [ << ] | [ Up ] | [ >> ] | [Top] | [Contents] | [Index] | [ ? ] |
4.14.4 Set/Show listing on stop (‘set autolist’)
| [ < ] | [ > ] | [ << ] | [ Up ] | [ >> ] | [Top] | [Contents] | [Index] | [ ? ] |
4.14.5 File basename (‘set basename’)
-
set basename [ on | 1 ]
- When set on, source filenames are shown as the shorter “basename” only. (Directory paths are omitted). This is useful in running the regression tests and may useful in showing debugger examples as in this text. You may also just want less verbose filename display.
-
set basename [ off | 0 ]
- Source filenames are shown as with their full path. This is the default.
| [ < ] | [ > ] | [ << ] | [ Up ] | [ >> ] | [Top] | [Contents] | [Index] | [ ? ] |
4.14.6 Allow Debugging the debugger (‘set debugger’)
-
set debugger [ on | 1 ]
- Allow the possibility of debugging this debugger. Somewhat of an arcane thing to do. For gurus, and even he doesn’t use it all that much.
-
set debugger [ off | 0 ]
- Don’t allow debugging into the debugger. This is the default.
| [ < ] | [ > ] | [ << ] | [ Up ] | [ >> ] | [Top] | [Contents] | [Index] | [ ? ] |
4.14.7 Specifying a Script-File Association (‘file’)
Sometimes the BASH debugger gets confused about where to find the script source file for the name reported to it by bash. To resolve relative file names that bash supplies via
BASH_SOURCE
, the BASH debugger uses the current working directory when the debugged script was started as well as the current working directory now (which might be different if a “cd” command was issued to change the working directory).
However sometimes this doesn’t work and there is a way to override this.
-
file script-file
- Directs the BASH debugger to use script-file whenever bash would have it refers to the filename given in
BASH_SOURCE
. The filename specified in
BASH_SOURCE
that gets overridden is shown when is this command is issued.
| [ < ] | [ > ] | [ << ] | [ Up ] | [ >> ] | [Top] | [Contents] | [Index] | [ ? ] |
4.14.8 Show position information as statements are executed (‘set linetrace’)
BASH has “
set -x
” tracing to show commands as they are run. However missing from this is file and line position information. So the debugger compensates here for what I think is deficiency of BASH by providing this information. The downside is that this tracing is slower than the built-in tracing of BASH.
The status of whether line tracing is enabled can be show via
show linetrace
.
| [ < ] | [ > ] | [ << ] | [ Up ] | [ >> ] | [Top] | [Contents] | [Index] | [ ? ] |
4.14.9 Logging output (‘set logging’, ‘set logging file’…)
You may want to save the output of the debugger commands to a file. There are several commands to control the debuggers’s logging.
-
set logging
- Prints
set logging
-
set logging [ on | 1 ]
- Enable or Disable logging.
-
set logging file filename
- Change the name of the current logfile. The default logfile is ‘bashdb.txt’.
-
set logging overwrite [ on | 1 ]
- By default, the debugger will append to the logfile. Set
overwrite
if you want
set logging on
to overwrite the logfile instead.
-
set logging redirect [ on | 1 ]
- By default, the debugger output will go to both the terminal and the logfile. Set
redirect
if you want output to go only to the log file.
-
show logging
- Show the current values of the logging settings.
| [ < ] | [ > ] | [ << ] | [ Up ] | [ >> ] | [Top] | [Contents] | [Index] | [ ? ] |
4.14.10 Prompt (‘set prompt’, ‘show prompt’)
The BASH debugger indicates its readiness to read a command by printing a string called the prompt. This string is normally:
bashdb${_Dbg_less}${#_Dbg_history[@]}${_Dbg_greater}$_Dbg_space
|
When variables inside the the prompt string are evaluated, the above becomes something like ‘bashdb<5>’ if this is the fifth command executed or perhaps ‘bashdb<<2>>’ if you have called the debugger from inside a debugger session and this is the second command inside the debugger session or perhaps ‘bashdb<(6)>’ if you entered a subshell after the fifth command.
You can change the prompt string with the
set prompt
command, although it is not normally advisable to do so without understanding the implications. If you are using the DDD GUI, it changes the changes the prompt and should not do so. In certain other circumstances (such as writing a GUI like DDD), it may be is useful to change the prompt.
Note:
set prompt
does not add a space for you after the prompt you set. This allows you to set a prompt which ends in a space or a prompt that does not. Furthermore due to a implementation limitation (resulting from a limitation of the bash built-in function “read”), to put a space at the end of the prompt use the ‘$_Dbg_space’ variable.
-
set prompt newprompt
- Directs the BASH debugger to use newprompt as its prompt string henceforth.
Warning: changing the prompt can DDD’s ability to understand when the debugger is waiting for input.
-
show prompt
- Prints a line of the form: ‘bashdb’s prompt is: your-prompt’
| [ < ] | [ > ] | [ << ] | [ Up ] | [ >> ] | [Top] | [Contents] | [Index] | [ ? ] |
4.14.11 Command editing (‘set editing’, ‘show editing’)
the BASH debugger reads its input commands through bash which uses via the readline interface. This GNU library provides consistent behavior for programs which provide a command line interface to the user. Advantages are GNU Emacs-style or vi-style inline editing of commands,
csh
-like history substitution, and a storage and recall of command history across debugging sessions.
You may control the behavior of command line editing in BASH with the command
set
.
-
set editing
-
set editing [ on | 1 ]
- Enable command line editing (enabled by default).
-
set editing [ off | 0 ]
- Disable command line editing.
-
show editing
- Show whether command line editing is enabled.
| [ < ] | [ > ] | [ << ] | [ Up ] | [ >> ] | [Top] | [Contents] | [Index] | [ ? ] |
4.14.12 Debugger Commands Tracing (‘set trace-commands’, ‘show trace-commands’)
If you need to debug user-defined commands or sourced files you may find it useful to enable command tracing. In this mode each command will be printed as it is executed, prefixed with one or more ‘+’ symbols, the quantity denoting the call depth of each command.
-
set trace-commands on
- Enable command tracing.
-
set trace-commands off
- Disable command tracing.
-
show trace-commands
- Display the current state of command tracing.
| [ < ] | [ > ] | [ << ] | [ Up ] | [ >> ] | [Top] | [Contents] | [Index] | [ ? ] |
4.14.13 Command Display (‘set showcommand’)
The debugger normally lists the line number and source line of the for the statement to be next executed. Often this line contains one expression or one statement and it is clear from this line what’s going to happen. However BASH allows many expressions or statements to be put on a single source line; some lines contain several units of execution. Some examples of this behavior are listed below:
x=1; y=2; x=3 (( x > 5 )) && x=5 y=`echo *` |
In the first line of the example above, we have three assignment statements on a single line. In the second line of the example above we have a statement which gets run only if a condition tests true. And in the third line of the example above, we have a command that gets run and then the output of that is substituted in an assignment statement. If you were single stepping inside the debugger, each line might get listed more than once before each of the actions that might get performed. (In the case of the conditional statement, the line gets listed only once when the condition is false.)
In order to assist understanding where you are, the enhanced version of BASH maintains a dynamic variable
BASH_COMMAND
that contains piece of code next to be run (or is currently being run). The debugger has arranged to save this and can display this information or not. This is controlled by
set showcommand
.
-
set showcommand [auto | on | 1 | off | 0 ]
- controls whether or not to show the saved
BASH_COMMAND
for the command next to be executed.
When the value is
auto
the following heuristic is used to determine whether or not to display the saved
BASH_COMMAND
. If the last time you stopped you were at the same place and the command string has changed, then show the command. When the value
on
is used, the debugger always shows
BASH_COMMAND
and when
off
is used, the debugger never shows
BASH_COMMAND
. Note that listing the text of the source line is independent of whether or not the command is also listed.
Some examples:
set showcommand auto This is the default set showcommand on Always show the next command to be executed set showcommand off Never show the next command to be executed |
| [ < ] | [ > ] | [ << ] | [ Up ] | [ >> ] | [Top] | [Contents] | [Index] | [ ? ] |
4.14.14 Command history (‘H’, ‘history’, ‘!’)
The BASH debugger can keep track of the commands you type during your debugging sessions, so that you can be certain of precisely what happened. If the prompt has not been changed (see Prompt), the history number that will be in use next is by default listed in the debugger prompt. Invalid commands and history commands are not saved on the history stack.
-
H [start-number [end-number]]
-
H [-count]
-
![-]n:p
- You can list what is in the history stack with
H
. Debugger commands in the history stack are listed from most recent to least recent. If no start-number is given we start with the most recently executed command and end with the first entry in the history stack. If start-number is given, that history number is listed first. If end-number is given, that history number is listed last. If a single negative number is given list that many history commands.
An alternate form is
!n:p
or
!-n:p
where n is an integer. If a minus sign is used, n is taken as the count to go back from the end rather than as a absolute history number. In contrast
H
, this form only prints a single history item.
Some examples:
H      List entire history
H -2   List the last two history items
!-2:p  List a single history item starting at the same place as above
H 5    List history from history number 5 to the beginning (number 0)
H 5 0  Same as above
H 5 3  List history from history number 5 down to history number 3
!5:p   List a single history item 5
-
history [[-]n]
-
![-]n
- Use this command to reexecute a given history number. If no number is given, the last debugger command in the history is executed.
An alternate form is
!n
or
!-n
where n is an integer.
If a minus sign is used in in either form, n is taken as the count to go back from the end rather than as a absolute history number.
Use these commands to manage the the BASH debugger command history facility.
-
set history save
-
set history save [ on | 1 ]
- Record command history in a file, whose name may be specified with the
set history filename
command. By default, this option is enabled.
-
set history save [ off | 0 ]
- Stop recording command history in a file.
-
set history size size
- Set the number of commands which BASH keeps in its history list. This defaults to the value of the environment variable
HISTSIZE
, or to 256 if this variable is not set.
-
show history
-
show history save
-
show history size
- These commands display the state of the BASH history parameters.
show history
by itself displays all states.
-
show commands
- Display the last ten commands in the command history.
-
show commands n
- Print ten commands centered on command number n.
-
show commands +
- Print ten commands just after the commands last printed.
| [ < ] | [ > ] | [ << ] | [ Up ] | [ >> ] | [Top] | [Contents] | [Index] | [ ? ] |
4.14.15 Command Completion (‘complete’)
The
complete args
command lists all the possible completions for the beginning of a command. We can also show completions for
set
,
show
and
info
subcommands. Use args to specify the beginning of the command you want completed. For example:
complete d |
results in:
d debug delete disable display deleteall down |
And
complete set a |
results in:
set args set annotate |
This is intended for use by front-ends such as GNU Emacs and DDD.
| [ < ] | [ > ] | [ << ] | [ Up ] | [ >> ] | [Top] | [Contents] | [Index] | [ ? ] |
5. Reporting Bugs
Your bug reports play an essential role in making the BASH debugger reliable.
Reporting a bug may help you by bringing a solution to your problem, or it may not. But in any case the principal function of a bug report is to help the entire community by making the next version of the BASH debugger work better. Bug reports are your contribution to the maintenance of the BASH debugger.
In order for a bug report to serve its purpose, you must include the information that enables us to fix the bug.
| 5.1 Have you found a bug? | ||
| 5.2 How to report bugs |
| [ < ] | [ > ] | [ << ] | [ Up ] | [ >> ] | [Top] | [Contents] | [Index] | [ ? ] |
5.1 Have you found a bug?
If you are not sure whether you have found a bug, here are some guidelines:
- If the debugger gets a fatal signal, for any input whatever, that is a the BASH debugger bug. Reliable debuggers never crash.
- If the BASH debugger produces an error message for valid input, that is a bug. (Note that if you’re cross debugging, the problem may also be somewhere in the connection to the target.)
- If the BASH debugger does not produce an error message for invalid input, that is a bug. However, you should note that your idea of “invalid input” might be our idea of “an extension” or “support for traditional practice”.
- If you are an experienced user of debugging tools, your suggestions for improvement of the BASH debugger are welcome in any case.
| [ < ] | [ > ] | [ << ] | [ Up ] | [ >> ] | [Top] | [Contents] | [Index] | [ ? ] |
5.2 How to report bugs
Bug reports can sent via the sourceforge bug tracking mechanism at http://sourceforge.net/tracker/?group_id=61395&atid=497159. Of course patches are very much welcome too. Those can also be sent via the same mechanism.
The fundamental principle of reporting bugs usefully is this: report all the facts. If you are not sure whether to state a fact or leave it out, state it!
Often people omit facts because they think they know what causes the problem and assume that some details do not matter. Thus, you might assume that the name of the variable you use in an example does not matter. Well, probably it does not, but one cannot be sure. Perhaps the bug is a stray memory reference which happens to fetch from the location where that name is stored in memory; perhaps, if the name were different, the contents of that location would fool the debugger into doing the right thing despite the bug. Play it safe and give a specific, complete example. That is the easiest thing for you to do, and the most helpful.
Keep in mind that the purpose of a bug report is to enable us to fix the bug. It may be that the bug has been reported previously, but neither you nor we can know that unless your bug report is complete and self-contained.
Sometimes people give a few sketchy facts and ask, “Does this ring a bell?” Those bug reports are useless, and we urge everyone to refuse to respond to them except to chide the sender to report bugs properly.
To enable us to fix the bug, you should include all these things:
- The version of the BASH debugger. the BASH debugger announces it if you start with no arguments; you can also print it at any time using
version
command.Without this, we will not know whether there is any point in looking for the bug in the current version of the BASH debugger.
- The type of machine you are using, and the operating system name and version number.
- What compiler (and its version) was used to compile BASH—e.g. “gcc 3.4”.
- The command arguments you gave the compiler to compile your example and observe the bug. For example, did you use ‘-O’? To guarantee you will not omit something important, list them all. A copy of the Makefile (or the output from make) is sufficient.If we were to try to guess the arguments, we would probably guess wrong and then we might not encounter the bug.
- A complete input script, and all necessary source files, that will reproduce the bug.
- A description of what behavior you observe that you believe is incorrect. For example, “It gets a fatal signal.”Of course, if the bug is that the BASH debugger gets a fatal signal, then we will certainly notice it. But if the bug is incorrect output, we might not notice unless it is glaringly wrong. You might as well not give us a chance to make a mistake.Even if the problem you experience is a fatal signal, you should still say so explicitly. Suppose something strange is going on, such as, your copy of the BASH debugger is out of synch, or you have encountered a bug in the C library on your system. (This has happened!) Your copy might crash and ours would not. If you told us to expect a crash, then when ours fails to crash, we would know that the bug was not happening for us. If you had not told us to expect a crash, then we would not be able to draw any conclusion from our observations.
- If you wish to suggest changes to the the BASH debugger source, send us context diffs. If you even discuss something in the the BASH debugger source, refer to it by context, not by line number.The line numbers in our development sources will not match those in your sources. Your line numbers would convey no useful information to us.
Here are some things that are not necessary:
- A description of the envelope of the bug.Often people who encounter a bug spend a lot of time investigating which changes to the input file will make the bug go away and which changes will not affect it.This is often time consuming and not very useful, because the way we will find the bug is by running a single example under the debugger with breakpoints, not by pure deduction from a series of examples. We recommend that you save your time for something else.Of course, if you can find a simpler example to report instead of the original one, that is a convenience for us. Errors in the output will be easier to spot, running under the debugger will take less time, and so on.However, simplification is not vital; if you do not want to do this, report the bug anyway and send us the entire test case you used.
- A patch for the bug.A patch for the bug does help us if it is a good one. But do not omit the necessary information, such as the test case, on the assumption that a patch is all we need. We might see problems with your patch and decide to fix the problem another way, or we might not understand it at all.Sometimes with a program as complicated as the BASH debugger it is very hard to construct an example that will make the program follow a certain path through the code. If you do not send us the example, we will not be able to construct one, so we will not be able to verify that the bug is fixed.And if we cannot understand what bug you are trying to fix, or why your patch should be an improvement, we will not install it. A test case will help us to understand.
- A guess about what the bug is or what it depends on.Such guesses are usually wrong. Even we cannot guess right about such things without first using the debugger to find the facts.
| [ < ] | [ > ] | [ << ] | [ Up ] | [ >> ] | [Top] | [Contents] | [Index] | [ ? ] |
6. History and Acknowledgments
The suggestion for a debugger for a Bourne-like shell came from the book “Learning the Korn Shell”, by Bill Rosenblatt Copyright (C) 1993 by O’Reilly and Associates, Inc. Others such as Cigy Cyriac, Chet Ramey, Rocky Bernstein, and Gary V. Vaughan expanded and improved on that.
However Bourne-Shell debuggers rely on a signal mechanism (
SIGDEBUG
) to call a debugger routine. In the Korn shell as well as BASH in versions prior to 2.05, there was a fundamental flaw: the routine that you registered in the trap, got called after the statement was executed. It takes little imagination to realize that this is a bit too late to find and correct errors, especially if the offending command happens to do serious damage like remove filesystems or reboot a server. As a horrible hack, these debuggers added one to the line number that was just executed on the wishful thinking that this would then be the line of next statement to execute. Sometimes this was correct, but it was too often wrong, such as in loops and conditionals, comments, or commands that are continued on the next line.
Another failing of these debuggers was the inability to debug into functions or into sourced files, provide a stack trace, dynamically skip a statement to be run, unconditionally trace into a function or subshell, or stop when a subroutine, sourced file, or subshell completed. In truth, the crux of the problem lay in debugging support in BASH. Given that there was limited bash debugging support, it is not surprising that these debuggers could not do any of the things listed above and could debug only a single shell in a single source file: lines could be listed only from a single text, breakpoints were set into the text which was in fact a copy of the script name prepended with debugger routines.
In version 2.04 of BASH, Rocky Bernstein started hacking on BASH to add call-stack information, source file information, allow for debugging into functions and for reporting line numbers in functions as relative to the file rather than the beginning of a function whose origin line number was not accessible from BASH. He started changing the user commands in bashdb to be like other more-advanced debuggers, in particular
perl5db
and
gdb
. However he gave up on this project when realizing that stopping before a line was crucial. A patch for this was nontrivial and wildly changed semantics. Furthermore the chance of getting his other patches into BASH was was not going to happen in version 2.04.
In version 2.05, the fundamental necessary change to the semantics of
SIGDEBUG
trap handling (suggested at least two years earlier) was made. Also, version 2.05 changed the line-number reporting in a function to be relative to the beginning of the file rather than the beginning of a function—sometimes. Rocky then picked up where he left off and this then became this debugger. A complete rewrite of the debugger, some of which started in 2.04 was undertaken. Debugger internals were changed to support multiple file names, save and restore the calling environment (such as variables
$1
and
$?
) and install debugger signal handlers. Work was also done on the BASH in conjunction with the debugger to save stack trace information, provide a means for stopping after a routine finished, debugging into a subshell and so on. And a number of changes were made to BASH just to improve the accuracy of the line number reporting which is crucial in a debugger.
This documentation was modified from the GNU Debugger (GDB) Reference manual.
Additions to this section are particularly welcome. If you or your friends (or enemies, to be evenhanded) have been unfairly omitted from this list, we would like to add your names!
The following have contributed directly or indirectly to bashdb:
Rocky Bernstein (initial full-featured bashdb with stack tracing and multi-file support)
Masatake YAMATO (help to merge Rocky’s hack to the official bash source tree)
Rod Smith (for creating and hosting a nicely formatted version of this manual that you are probably reading online)
Bill Rosenblatt (kshdb), Michael Loukides (kshdb), Cigy Cyriac (proto bashdb), Chet Ramey (proto bashdb), and Gary V. Vaughan (proto bashdb).
Authors of per5ldb:
Ray Lischner, Johan Vromans, and Ilya Zakharevich.
Authors of GDB:
Richard Stallman, Andrew Cagney, Jim Blandy, Jason Molenda, Stan Shebs, Fred Fish, Stu Grossman, John Gilmore, Jim Kingdon, and Randy Smith (to name just a few).
Authors of GUD:
Eric S. Raymond.
| [ < ] | [ > ] | [ << ] | [ Up ] | [ >> ] | [Top] | [Contents] | [Index] | [ ? ] |
A. GNU GENERAL PUBLIC LICENSE
Version 2, June 1991
Copyright © 1989, 1991 Free Software Foundation, Inc. 59 Temple Place - Suite 330, Boston, MA 02111-1307, USA Everyone is permitted to copy and distribute verbatim copies of this license document, but changing it is not allowed. |
| [ < ] | [ > ] | [ << ] | [ Up ] | [ >> ] | [Top] | [Contents] | [Index] | [ ? ] |
Preamble
The licenses for most software are designed to take away your freedom to share and change it. By contrast, the GNU General Public License is intended to guarantee your freedom to share and change free software—to make sure the software is free for all its users. This General Public License applies to most of the Free Software Foundation’s software and to any other program whose authors commit to using it. (Some other Free Software Foundation software is covered by the GNU Library General Public License instead.) You can apply it to your programs, too.
When we speak of free software, we are referring to freedom, not price. Our General Public Licenses are designed to make sure that you have the freedom to distribute copies of free software (and charge for this service if you wish), that you receive source code or can get it if you want it, that you can change the software or use pieces of it in new free programs; and that you know you can do these things.
To protect your rights, we need to make restrictions that forbid anyone to deny you these rights or to ask you to surrender the rights. These restrictions translate to certain responsibilities for you if you distribute copies of the software, or if you modify it.
For example, if you distribute copies of such a program, whether gratis or for a fee, you must give the recipients all the rights that you have. You must make sure that they, too, receive or can get the source code. And you must show them these terms so they know their rights.
We protect your rights with two steps: (1) copyright the software, and (2) offer you this license which gives you legal permission to copy, distribute and/or modify the software.
Also, for each author’s protection and ours, we want to make certain that everyone understands that there is no warranty for this free software. If the software is modified by someone else and passed on, we want its recipients to know that what they have is not the original, so that any problems introduced by others will not reflect on the original authors’ reputations.
Finally, any free program is threatened constantly by software patents. We wish to avoid the danger that redistributors of a free program will individually obtain patent licenses, in effect making the program proprietary. To prevent this, we have made it clear that any patent must be licensed for everyone’s free use or not licensed at all.
The precise terms and conditions for copying, distribution and modification follow.
TERMS AND CONDITIONS FOR COPYING, DISTRIBUTION AND MODIFICATION
- This License applies to any program or other work which contains a notice placed by the copyright holder saying it may be distributed under the terms of this General Public License. The “Program”, below, refers to any such program or work, and a “work based on the Program” means either the Program or any derivative work under copyright law: that is to say, a work containing the Program or a portion of it, either verbatim or with modifications and/or translated into another language. (Hereinafter, translation is included without limitation in the term “modification”.) Each licensee is addressed as “you”.Activities other than copying, distribution and modification are not covered by this License; they are outside its scope. The act of running the Program is not restricted, and the output from the Program is covered only if its contents constitute a work based on the Program (independent of having been made by running the Program). Whether that is true depends on what the Program does.
- You may copy and distribute verbatim copies of the Program’s source code as you receive it, in any medium, provided that you conspicuously and appropriately publish on each copy an appropriate copyright notice and disclaimer of warranty; keep intact all the notices that refer to this License and to the absence of any warranty; and give any other recipients of the Program a copy of this License along with the Program.You may charge a fee for the physical act of transferring a copy, and you may at your option offer warranty protection in exchange for a fee.
- You may modify your copy or copies of the Program or any portion of it, thus forming a work based on the Program, and copy and distribute such modifications or work under the terms of Section 1 above, provided that you also meet all of these conditions:
- You must cause the modified files to carry prominent notices stating that you changed the files and the date of any change.
- You must cause any work that you distribute or publish, that in whole or in part contains or is derived from the Program or any part thereof, to be licensed as a whole at no charge to all third parties under the terms of this License.
- If the modified program normally reads commands interactively when run, you must cause it, when started running for such interactive use in the most ordinary way, to print or display an announcement including an appropriate copyright notice and a notice that there is no warranty (or else, saying that you provide a warranty) and that users may redistribute the program under these conditions, and telling the user how to view a copy of this License. (Exception: if the Program itself is interactive but does not normally print such an announcement, your work based on the Program is not required to print an announcement.)
These requirements apply to the modified work as a whole. If identifiable sections of that work are not derived from the Program, and can be reasonably considered independent and separate works in themselves, then this License, and its terms, do not apply to those sections when you distribute them as separate works. But when you distribute the same sections as part of a whole which is a work based on the Program, the distribution of the whole must be on the terms of this License, whose permissions for other licensees extend to the entire whole, and thus to each and every part regardless of who wrote it.
Thus, it is not the intent of this section to claim rights or contest your rights to work written entirely by you; rather, the intent is to exercise the right to control the distribution of derivative or collective works based on the Program.
In addition, mere aggregation of another work not based on the Program with the Program (or with a work based on the Program) on a volume of a storage or distribution medium does not bring the other work under the scope of this License.
- You may copy and distribute the Program (or a work based on it, under Section 2) in object code or executable form under the terms of Sections 1 and 2 above provided that you also do one of the following:
- Accompany it with the complete corresponding machine-readable source code, which must be distributed under the terms of Sections 1 and 2 above on a medium customarily used for software interchange; or,
- Accompany it with a written offer, valid for at least three years, to give any third party, for a charge no more than your cost of physically performing source distribution, a complete machine-readable copy of the corresponding source code, to be distributed under the terms of Sections 1 and 2 above on a medium customarily used for software interchange; or,
- Accompany it with the information you received as to the offer to distribute corresponding source code. (This alternative is allowed only for noncommercial distribution and only if you received the program in object code or executable form with such an offer, in accord with Subsection b above.)
The source code for a work means the preferred form of the work for making modifications to it. For an executable work, complete source code means all the source code for all modules it contains, plus any associated interface definition files, plus the scripts used to control compilation and installation of the executable. However, as a special exception, the source code distributed need not include anything that is normally distributed (in either source or binary form) with the major components (compiler, kernel, and so on) of the operating system on which the executable runs, unless that component itself accompanies the executable.
If distribution of executable or object code is made by offering access to copy from a designated place, then offering equivalent access to copy the source code from the same place counts as distribution of the source code, even though third parties are not compelled to copy the source along with the object code.
- You may not copy, modify, sublicense, or distribute the Program except as expressly provided under this License. Any attempt otherwise to copy, modify, sublicense or distribute the Program is void, and will automatically terminate your rights under this License. However, parties who have received copies, or rights, from you under this License will not have their licenses terminated so long as such parties remain in full compliance.
- You are not required to accept this License, since you have not signed it. However, nothing else grants you permission to modify or distribute the Program or its derivative works. These actions are prohibited by law if you do not accept this License. Therefore, by modifying or distributing the Program (or any work based on the Program), you indicate your acceptance of this License to do so, and all its terms and conditions for copying, distributing or modifying the Program or works based on it.
- Each time you redistribute the Program (or any work based on the Program), the recipient automatically receives a license from the original licensor to copy, distribute or modify the Program subject to these terms and conditions. You may not impose any further restrictions on the recipients’ exercise of the rights granted herein. You are not responsible for enforcing compliance by third parties to this License.
- If, as a consequence of a court judgment or allegation of patent infringement or for any other reason (not limited to patent issues), conditions are imposed on you (whether by court order, agreement or otherwise) that contradict the conditions of this License, they do not excuse you from the conditions of this License. If you cannot distribute so as to satisfy simultaneously your obligations under this License and any other pertinent obligations, then as a consequence you may not distribute the Program at all. For example, if a patent license would not permit royalty-free redistribution of the Program by all those who receive copies directly or indirectly through you, then the only way you could satisfy both it and this License would be to refrain entirely from distribution of the Program.If any portion of this section is held invalid or unenforceable under any particular circumstance, the balance of the section is intended to apply and the section as a whole is intended to apply in other circumstances.It is not the purpose of this section to induce you to infringe any patents or other property right claims or to contest validity of any such claims; this section has the sole purpose of protecting the integrity of the free software distribution system, which is implemented by public license practices. Many people have made generous contributions to the wide range of software distributed through that system in reliance on consistent application of that system; it is up to the author/donor to decide if he or she is willing to distribute software through any other system and a licensee cannot impose that choice.This section is intended to make thoroughly clear what is believed to be a consequence of the rest of this License.
- If the distribution and/or use of the Program is restricted in certain countries either by patents or by copyrighted interfaces, the original copyright holder who places the Program under this License may add an explicit geographical distribution limitation excluding those countries, so that distribution is permitted only in or among countries not thus excluded. In such case, this License incorporates the limitation as if written in the body of this License.
- The Free Software Foundation may publish revised and/or new versions of the General Public License from time to time. Such new versions will be similar in spirit to the present version, but may differ in detail to address new problems or concerns.Each version is given a distinguishing version number. If the Program specifies a version number of this License which applies to it and “any later version”, you have the option of following the terms and conditions either of that version or of any later version published by the Free Software Foundation. If the Program does not specify a version number of this License, you may choose any version ever published by the Free Software Foundation.
- If you wish to incorporate parts of the Program into other free programs whose distribution conditions are different, write to the author to ask for permission. For software which is copyrighted by the Free Software Foundation, write to the Free Software Foundation; we sometimes make exceptions for this. Our decision will be guided by the two goals of preserving the free status of all derivatives of our free software and of promoting the sharing and reuse of software generally.
NO WARRANTY
- BECAUSE THE PROGRAM IS LICENSED FREE OF CHARGE, THERE IS NO WARRANTY FOR THE PROGRAM, TO THE EXTENT PERMITTED BY APPLICABLE LAW. EXCEPT WHEN OTHERWISE STATED IN WRITING THE COPYRIGHT HOLDERS AND/OR OTHER PARTIES PROVIDE THE PROGRAM “AS IS” WITHOUT WARRANTY OF ANY KIND, EITHER EXPRESSED OR IMPLIED, INCLUDING, BUT NOT LIMITED TO, THE IMPLIED WARRANTIES OF MERCHANTABILITY AND FITNESS FOR A PARTICULAR PURPOSE. THE ENTIRE RISK AS TO THE QUALITY AND PERFORMANCE OF THE PROGRAM IS WITH YOU. SHOULD THE PROGRAM PROVE DEFECTIVE, YOU ASSUME THE COST OF ALL NECESSARY SERVICING, REPAIR OR CORRECTION.
- IN NO EVENT UNLESS REQUIRED BY APPLICABLE LAW OR AGREED TO IN WRITING WILL ANY COPYRIGHT HOLDER, OR ANY OTHER PARTY WHO MAY MODIFY AND/OR REDISTRIBUTE THE PROGRAM AS PERMITTED ABOVE, BE LIABLE TO YOU FOR DAMAGES, INCLUDING ANY GENERAL, SPECIAL, INCIDENTAL OR CONSEQUENTIAL DAMAGES ARISING OUT OF THE USE OR INABILITY TO USE THE PROGRAM (INCLUDING BUT NOT LIMITED TO LOSS OF DATA OR DATA BEING RENDERED INACCURATE OR LOSSES SUSTAINED BY YOU OR THIRD PARTIES OR A FAILURE OF THE PROGRAM TO OPERATE WITH ANY OTHER PROGRAMS), EVEN IF SUCH HOLDER OR OTHER PARTY HAS BEEN ADVISED OF THE POSSIBILITY OF SUCH DAMAGES.
END OF TERMS AND CONDITIONS
| [ < ] | [ > ] | [ << ] | [ Up ] | [ >> ] | [Top] | [Contents] | [Index] | [ ? ] |
How to Apply These Terms to Your New Programs
If you develop a new program, and you want it to be of the greatest possible use to the public, the best way to achieve this is to make it free software which everyone can redistribute and change under these terms.
To do so, attach the following notices to the program. It is safest to attach them to the start of each source file to most effectively convey the exclusion of warranty; and each file should have at least the “copyright” line and a pointer to where the full notice is found.
one line to give the program's name and a brief idea of what it does. Copyright (C) year name of author This program is free software; you can redistribute it and/or modify it under the terms of the GNU General Public License as published by the Free Software Foundation; either version 2 of the License, or (at your option) any later version. This program is distributed in the hope that it will be useful, but WITHOUT ANY WARRANTY; without even the implied warranty of MERCHANTABILITY or FITNESS FOR A PARTICULAR PURPOSE. See the GNU General Public License for more details. You should have received a copy of the GNU General Public License along with this program; if not, write to the Free Software Foundation, Inc., 59 Temple Place - Suite 330, Boston, MA 02111-1307, USA. |
Also add information on how to contact you by electronic and paper mail.
If the program is interactive, make it output a short notice like this when it starts in an interactive mode:
Gnomovision version 69, Copyright (C) year name of author Gnomovision comes with ABSOLUTELY NO WARRANTY; for details type `show w'. This is free software, and you are welcome to redistribute it under certain conditions; type `show c' for details. |
The hypothetical commands ‘show w’ and ‘show c’ should show the appropriate parts of the General Public License. Of course, the commands you use may be called something other than ‘show w’ and ‘show c’; they could even be mouse-clicks or menu items—whatever suits your program.
You should also get your employer (if you work as a programmer) or your school, if any, to sign a “copyright disclaimer” for the program, if necessary. Here is a sample; alter the names:
Yoyodyne, Inc., hereby disclaims all copyright interest in the program `Gnomovision' (which makes passes at compilers) written by James Hacker. signature of Ty Coon, 1 April 1989 Ty Coon, President of Vice |
This General Public License does not permit incorporating your program into proprietary programs. If your program is a subroutine library, you may consider it more useful to permit linking proprietary applications with the library. If this is what you want to do, use the GNU Library General Public License instead of this License.
| [ < ] | [ > ] | [ << ] | [ Up ] | [ >> ] | [Top] | [Contents] | [Index] | [ ? ] |
B. GNU Free Documentation License
Version 1.1, March 2000
Copyright (C) 2000 Free Software Foundation, Inc. 59 Temple Place, Suite 330, Boston, MA 02111-1307 USA Everyone is permitted to copy and distribute verbatim copies of this license document, but changing it is not allowed. |
- PREAMBLEThe purpose of this License is to make a manual, textbook, or other written document “free” in the sense of freedom: to assure everyone the effective freedom to copy and redistribute it, with or without modifying it, either commercially or noncommercially. Secondarily, this License preserves for the author and publisher a way to get credit for their work, while not being considered responsible for modifications made by others.This License is a kind of “copyleft”, which means that derivative works of the document must themselves be free in the same sense. It complements the GNU General Public License, which is a copyleft license designed for free software.We have designed this License in order to use it for manuals for free software, because free software needs free documentation: a free program should come with manuals providing the same freedoms that the software does. But this License is not limited to software manuals; it can be used for any textual work, regardless of subject matter or whether it is published as a printed book. We recommend this License principally for works whose purpose is instruction or reference.
- APPLICABILITY AND DEFINITIONSThis License applies to any manual or other work that contains a notice placed by the copyright holder saying it can be distributed under the terms of this License. The “Document”, below, refers to any such manual or work. Any member of the public is a licensee, and is addressed as “you.”A “Modified Version” of the Document means any work containing the Document or a portion of it, either copied verbatim, or with modifications and/or translated into another language.A “Secondary Section” is a named appendix or a front-matter section of the Document that deals exclusively with the relationship of the publishers or authors of the Document to the Document’s overall subject (or to related matters) and contains nothing that could fall directly within that overall subject. (For example, if the Document is in part a textbook of mathematics, a Secondary Section may not explain any mathematics.) The relationship could be a matter of historical connection with the subject or with related matters, or of legal, commercial, philosophical, ethical or political position regarding them.The “Invariant Sections” are certain Secondary Sections whose titles are designated, as being those of Invariant Sections, in the notice that says that the Document is released under this License.The “Cover Texts” are certain short passages of text that are listed, as Front-Cover Texts or Back-Cover Texts, in the notice that says that the Document is released under this License.A “Transparent” copy of the Document means a machine-readable copy, represented in a format whose specification is available to the general public, whose contents can be viewed and edited directly and straightforwardly with generic text editors or (for images composed of pixels) generic paint programs or (for drawings) some widely available drawing editor, and that is suitable for input to text formatters or for automatic translation to a variety of formats suitable for input to text formatters. A copy made in an otherwise Transparent file format whose markup has been designed to thwart or discourage subsequent modification by readers is not Transparent. A copy that is not “Transparent” is called “Opaque.”Examples of suitable formats for Transparent copies include plain ASCII without markup, Texinfo input format, LaTeX input format, SGML or XML using a publicly available DTD, and standard-conforming simple HTML designed for human modification. Opaque formats include PostScript, PDF, proprietary formats that can be read and edited only by proprietary word processors, SGML or XML for which the DTD and/or processing tools are not generally available, and the machine-generated HTML produced by some word processors for output purposes only.
The “Title Page” means, for a printed book, the title page itself, plus such following pages as are needed to hold, legibly, the material this License requires to appear in the title page. For works in formats which do not have any title page as such, “Title Page” means the text near the most prominent appearance of the work’s title, preceding the beginning of the body of the text.
- VERBATIM COPYINGYou may copy and distribute the Document in any medium, either commercially or noncommercially, provided that this License, the copyright notices, and the license notice saying this License applies to the Document are reproduced in all copies, and that you add no other conditions whatsoever to those of this License. You may not use technical measures to obstruct or control the reading or further copying of the copies you make or distribute. However, you may accept compensation in exchange for copies. If you distribute a large enough number of copies you must also follow the conditions in section 3.You may also lend copies, under the same conditions stated above, and you may publicly display copies.
- COPYING IN QUANTITYIf you publish printed copies of the Document numbering more than 100, and the Document’s license notice requires Cover Texts, you must enclose the copies in covers that carry, clearly and legibly, all these Cover Texts: Front-Cover Texts on the front cover, and Back-Cover Texts on the back cover. Both covers must also clearly and legibly identify you as the publisher of these copies. The front cover must present the full title with all words of the title equally prominent and visible. You may add other material on the covers in addition. Copying with changes limited to the covers, as long as they preserve the title of the Document and satisfy these conditions, can be treated as verbatim copying in other respects.If the required texts for either cover are too voluminous to fit legibly, you should put the first ones listed (as many as fit reasonably) on the actual cover, and continue the rest onto adjacent pages.If you publish or distribute Opaque copies of the Document numbering more than 100, you must either include a machine-readable Transparent copy along with each Opaque copy, or state in or with each Opaque copy a publicly-accessible computer-network location containing a complete Transparent copy of the Document, free of added material, which the general network-using public has access to download anonymously at no charge using public-standard network protocols. If you use the latter option, you must take reasonably prudent steps, when you begin distribution of Opaque copies in quantity, to ensure that this Transparent copy will remain thus accessible at the stated location until at least one year after the last time you distribute an Opaque copy (directly or through your agents or retailers) of that edition to the public.It is requested, but not required, that you contact the authors of the Document well before redistributing any large number of copies, to give them a chance to provide you with an updated version of the Document.
- MODIFICATIONSYou may copy and distribute a Modified Version of the Document under the conditions of sections 2 and 3 above, provided that you release the Modified Version under precisely this License, with the Modified Version filling the role of the Document, thus licensing distribution and modification of the Modified Version to whoever possesses a copy of it. In addition, you must do these things in the Modified Version:A. Use in the Title Page (and on the covers, if any) a title distinct from that of the Document, and from those of previous versions (which should, if there were any, be listed in the History section of the Document). You may use the same title as a previous version if the original publisher of that version gives permission.
B. List on the Title Page, as authors, one or more persons or entities responsible for authorship of the modifications in the Modified Version, together with at least five of the principal authors of the Document (all of its principal authors, if it has less than five).
C. State on the Title page the name of the publisher of the Modified Version, as the publisher.
D. Preserve all the copyright notices of the Document.
E. Add an appropriate copyright notice for your modifications adjacent to the other copyright notices.
F. Include, immediately after the copyright notices, a license notice giving the public permission to use the Modified Version under the terms of this License, in the form shown in the Addendum below.
G. Preserve in that license notice the full lists of Invariant Sections and required Cover Texts given in the Document’s license notice.
H. Include an unaltered copy of this License.
I. Preserve the section entitled “History”, and its title, and add to it an item stating at least the title, year, new authors, and publisher of the Modified Version as given on the Title Page. If there is no section entitled “History” in the Document, create one stating the title, year, authors, and publisher of the Document as given on its Title Page, then add an item describing the Modified Version as stated in the previous sentence.
J. Preserve the network location, if any, given in the Document for public access to a Transparent copy of the Document, and likewise the network locations given in the Document for previous versions it was based on. These may be placed in the “History” section. You may omit a network location for a work that was published at least four years before the Document itself, or if the original publisher of the version it refers to gives permission.
K. In any section entitled “Acknowledgements” or “Dedications”, preserve the section’s title, and preserve in the section all the substance and tone of each of the contributor acknowledgements and/or dedications given therein.
L. Preserve all the Invariant Sections of the Document, unaltered in their text and in their titles. Section numbers or the equivalent are not considered part of the section titles.
M. Delete any section entitled “Endorsements.” Such a section may not be included in the Modified Version.
N. Do not retitle any existing section as “Endorsements” or to conflict in title with any Invariant Section.If the Modified Version includes new front-matter sections or appendices that qualify as Secondary Sections and contain no material copied from the Document, you may at your option designate some or all of these sections as invariant. To do this, add their titles to the list of Invariant Sections in the Modified Version’s license notice. These titles must be distinct from any other section titles.You may add a section entitled “Endorsements”, provided it contains nothing but endorsements of your Modified Version by various parties–for example, statements of peer review or that the text has been approved by an organization as the authoritative definition of a standard.You may add a passage of up to five words as a Front-Cover Text, and a passage of up to 25 words as a Back-Cover Text, to the end of the list of Cover Texts in the Modified Version. Only one passage of Front-Cover Text and one of Back-Cover Text may be added by (or through arrangements made by) any one entity. If the Document already includes a cover text for the same cover, previously added by you or by arrangement made by the same entity you are acting on behalf of, you may not add another; but you may replace the old one, on explicit permission from the previous publisher that added the old one.The author(s) and publisher(s) of the Document do not by this License give permission to use their names for publicity for or to assert or imply endorsement of any Modified Version. - COMBINING DOCUMENTSYou may combine the Document with other documents released under this License, under the terms defined in section 4 above for modified versions, provided that you include in the combination all of the Invariant Sections of all of the original documents, unmodified, and list them all as Invariant Sections of your combined work in its license notice.The combined work need only contain one copy of this License, and multiple identical Invariant Sections may be replaced with a single copy. If there are multiple Invariant Sections with the same name but different contents, make the title of each such section unique by adding at the end of it, in parentheses, the name of the original author or publisher of that section if known, or else a unique number. Make the same adjustment to the section titles in the list of Invariant Sections in the license notice of the combined work.In the combination, you must combine any sections entitled “History” in the various original documents, forming one section entitled “History”; likewise combine any sections entitled “Acknowledgements”, and any sections entitled “Dedications.” You must delete all sections entitled “Endorsements.”
- COLLECTIONS OF DOCUMENTSYou may make a collection consisting of the Document and other documents released under this License, and replace the individual copies of this License in the various documents with a single copy that is included in the collection, provided that you follow the rules of this License for verbatim copying of each of the documents in all other respects.You may extract a single document from such a collection, and distribute it individually under this License, provided you insert a copy of this License into the extracted document, and follow this License in all other respects regarding verbatim copying of that document.
- AGGREGATION WITH INDEPENDENT WORKSA compilation of the Document or its derivatives with other separate and independent documents or works, in or on a volume of a storage or distribution medium, does not as a whole count as a Modified Version of the Document, provided no compilation copyright is claimed for the compilation. Such a compilation is called an “aggregate”, and this License does not apply to the other self-contained works thus compiled with the Document, on account of their being thus compiled, if they are not themselves derivative works of the Document.If the Cover Text requirement of section 3 is applicable to these copies of the Document, then if the Document is less than one quarter of the entire aggregate, the Document’s Cover Texts may be placed on covers that surround only the Document within the aggregate. Otherwise they must appear on covers around the whole aggregate.
- TRANSLATIONTranslation is considered a kind of modification, so you may distribute translations of the Document under the terms of section 4. Replacing Invariant Sections with translations requires special permission from their copyright holders, but you may include translations of some or all Invariant Sections in addition to the original versions of these Invariant Sections. You may include a translation of this License provided that you also include the original English version of this License. In case of a disagreement between the translation and the original English version of this License, the original English version will prevail.
- TERMINATIONYou may not copy, modify, sublicense, or distribute the Document except as expressly provided for under this License. Any other attempt to copy, modify, sublicense or distribute the Document is void, and will automatically terminate your rights under this License. However, parties who have received copies, or rights, from you under this License will not have their licenses terminated so long as such parties remain in full compliance.
- FUTURE REVISIONS OF THIS LICENSEThe Free Software Foundation may publish new, revised versions of the GNU Free Documentation License from time to time. Such new versions will be similar in spirit to the present version, but may differ in detail to address new problems or concerns. See http://www.gnu.org/copyleft/.Each version of the License is given a distinguishing version number. If the Document specifies that a particular numbered version of this License “or any later version” applies to it, you have the option of following the terms and conditions either of that specified version or of any later version that has been published (not as a draft) by the Free Software Foundation. If the Document does not specify a version number of this License, you may choose any version ever published (not as a draft) by the Free Software Foundation.
| [ < ] | [ > ] | [ << ] | [ Up ] | [ >> ] | [Top] | [Contents] | [Index] | [ ? ] |
ADDENDUM: How to use this License for your documents
To use this License in a document you have written, include a copy of the License in the document and put the following copyright and license notices just after the title page:
Copyright (C) year your name. Permission is granted to copy, distribute and/or modify this document under the terms of the GNU Free Documentation License, Version 1.1 or any later version published by the Free Software Foundation; with the Invariant Sections being list their titles, with the Front-Cover Texts being list, and with the Back-Cover Texts being list. A copy of the license is included in the section entitled "GNU Free Documentation License." |
If you have no Invariant Sections, write “with no Invariant Sections” instead of saying which ones are invariant. If you have no Front-Cover Texts, write “no Front-Cover Texts” instead of “Front-Cover Texts being list”; likewise for Back-Cover Texts.
If your document contains nontrivial examples of program code, we recommend releasing these examples in parallel under your choice of free software license, such as the GNU General Public License, to permit their use in free software.
| [ < ] | [ > ] | [ << ] | [ Up ] | [ >> ] | [Top] | [Contents] | [Index] | [ ? ] |
Command Index
| Jump to: | ! # A B C D E F H I K L N P Q R S T U V W X |
|---|
| Jump to: | ! # A B C D E F H I K L N P Q R S T U V W X |
|---|
| [ < ] | [ > ] | [ << ] | [ Up ] | [ >> ] | [Top] | [Contents] | [Index] | [ ? ] |
General Index
| Jump to: | $ – . A B C D E F H I L N O P R S T V W |
|---|
| Jump to: | $ – . A B C D E F H I L N O P R S T V W |
|---|
| [Top] | [Contents] | [Index] | [ ? ] |
Footnotes
(1)
Recall that variables in BASH don’t need to be declared before they are referred to and that the default value would be the a null value which here prints as an empty string.
(2)
The DJGPP port of the BASH debugger uses the name ‘bashdb.ini’ instead, due to the limitations of file names imposed by DOS filesystems.
(3)
On DOS/Windows systems, the home directory is the one pointed to by the
HOME
environment variable.
| [Top] | [Contents] | [Index] | [ ? ] |
Table of Contents
- 1. Summary of the BASH Debugger
- 2. Getting in and out
- 3. Script Setup inside the BASH Debugger
- 4. BASH Debugger Command Reference
- 4.1 Command syntax
- 4.2 Getting help (‘help’)
- 4.3 Quitting the BASH debugger (‘quit’, ‘kill’)
- 4.4 Stopping and Resuming Execution
- 4.5 Examining the Stack Frame (‘where’, ‘frame’, ‘up’, ‘down’)
- 4.6 Examining Source Files (‘list’)
- 4.7 Editing Source files (‘edit’)
- 4.8 Searching source files (‘search’, ‘reverse’, ‘/…/’, ‘?..?’)
- 4.9 Examining Data (‘print’, ‘examine’, ‘info variables’)
- 4.10 Automatic display (‘display’, ‘undisplay’)
- 4.11 Running Arbitrary BASH and Shell commands (‘eval’, ‘shell’)
- 4.12 Interfacing to the OS (‘cd’, ‘pwd’)
- 4.13 Status and Debugger Settings (‘info’, ‘show’)
- 4.14 Controlling bashdb (‘set’, ‘file’, ‘prompt’, ‘history’…)
- 4.14.1 Debugger Command Aliases (‘alias’)
- 4.14.2 Annotation Level (‘set annotate’)
- 4.14.3 Set/Show auto-eval (‘set autoeval’)
- 4.14.4 Set/Show listing on stop (‘set autolist’)
- 4.14.5 File basename (‘set basename’)
- 4.14.6 Allow Debugging the debugger (‘set debugger’)
- 4.14.7 Specifying a Script-File Association (‘file’)
- 4.14.8 Show position information as statements are executed (‘set linetrace’)
- 4.14.9 Logging output (‘set logging’, ‘set logging file’…)
- 4.14.10 Prompt (‘set prompt’, ‘show prompt’)
- 4.14.11 Command editing (‘set editing’, ‘show editing’)
- 4.14.12 Debugger Commands Tracing (‘set trace-commands’, ‘show trace-commands’)
- 4.14.13 Command Display (‘set showcommand’)
- 4.14.14 Command history (‘H’, ‘history’, ‘!’)
- 4.14.15 Command Completion (‘complete’)
- 5. Reporting Bugs
- 6. History and Acknowledgments
- A. GNU GENERAL PUBLIC LICENSE
- B. GNU Free Documentation License
- Command Index
- General Index
This document was generated by rocky on March 17, 2019 using texi2html 1.82.
Thanks!
i just wanted to say: THANKS TO ALL INVOLVED!
bashdb is really a complex piece of software and it does its job.
Links:
https://github.com/realgud/realgud/wiki/bashdb-notes
https://dwaves.de/2019/04/10/step-debugging-bash-terminal-shell-scripts-with-bashdb/
liked this article?
- only together we can create a truly free world
- plz support dwaves to keep it up & running!
- (yes the info on the internet is (mostly) free but beer is still not free (still have to work on that))
- really really hate advertisement
- contribute: whenever a solution was found, blog about it for others to find!
- talk about, recommend & link to this blog and articles
- thanks to all who contribute!