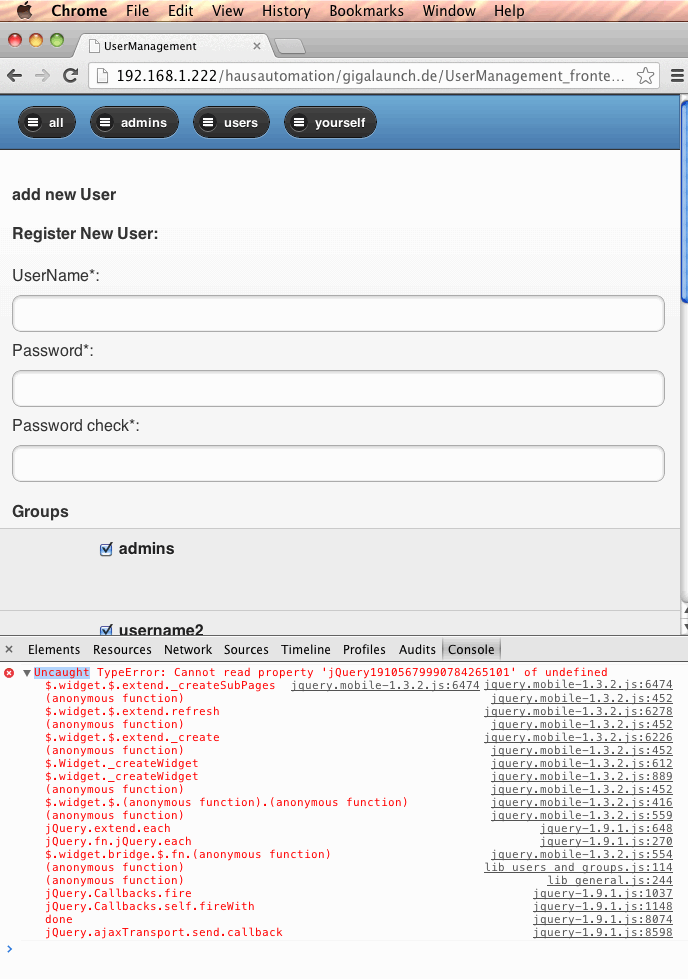
sometimes… you come across a javascript error… but the firebug addon in firefox won’t let you trace it completely to the origin.
after setting up chrome, open the problematic page and right-click -> inspect element.
this will open the debug view.
now go to the console tab and hit the red triangle next to your error… dada! there you have a full stack trace.
have fun… as i did… with figuring out why jquery mobile is doing this how it is doing.
liked this article?
- only together we can create a truly free world
- plz support dwaves to keep it up & running!
- (yes the info on the internet is (mostly) free but beer is still not free (still have to work on that))
- really really hate advertisement
- contribute: whenever a solution was found, blog about it for others to find!
- talk about, recommend & link to this blog and articles
- thanks to all who contribute!


