monitor (andoird) devices with bpf: https://www.socallinuxexpo.org/sites/default/files/presentations/bcc-scale.pdf
so guess “monitoring” is about two things:
- availability and performance:
- detect performance bottlenecks
- get informed if parts (harddisks) / servers have failed / are about to fail
- security:
- detect, report and (if possible) automatically fence off “unusual” network activity such as hacking attacks (DDoS / bruteforce)
… anything i have missed? (scroll down to comment please!)
hardware / software raid monitoring:
https://dwaves.de/2019/09/06/linux-server-monitor-software-raid-mail-notification-on-failure/
well hardware raid adapters actually should mail you / beep loud if a harddisk fails… unfortunately this worked for (got it working with LSI MegaRaid but not for Adaptec under Windows 2012 Server, untested for linux (yet))
wishlist: here needs to be a tested script that informs you when a harddisk goes down, that works with hardware-raid and software-raid:
software raid:
hp hardware raid:
untested: https://networklessons.com/uncategorized/send-e-mail-when-raid-fails-on-hp-proliant-running-linux/
“If you’re running Linux and don’t want to install the full HP management suite, you can develop a script around the cciss_vol_status utility to query controller/disk status. Also see: Installing HP Agents on OpenFiler” (src)
self made:
this script will output and follow changes to all log files on your server / workstation… very basic but can be handy to “checkout what the blackbox is currently doing”.
cat /scripts/mon_all_logs.sh
#!/bin/bash

find /var/log/ -type f \( -name "*" \) ! -path '*.gz*' -exec tail -n0 -f "$file" {} +
basic server monitoring:
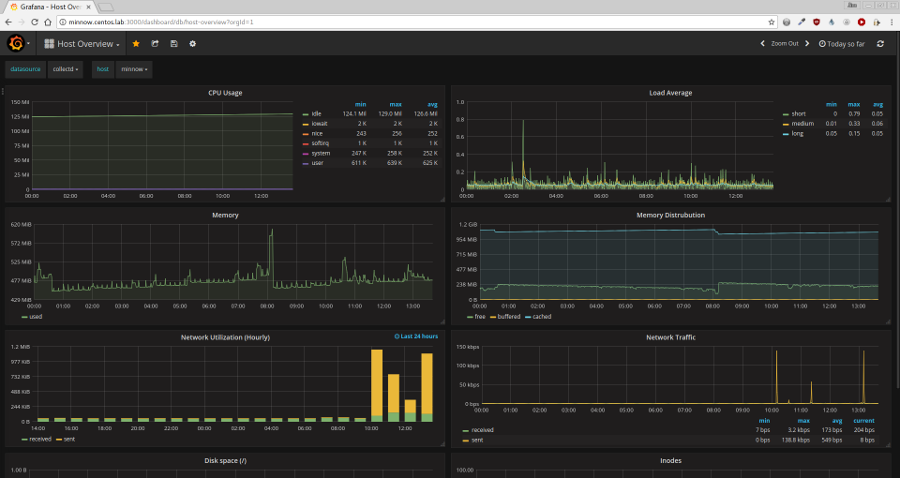
http://jperrin.org/centos/monitoring/grafana/keeping-an-eye-on-centos-performance-with-grafana/
for webservers: https://vestacp.com/ comes with a nice basic dashboard:
SHELL is using:
| Features | Splunk Free | Splunk Light | Splunk Enterprise | Splunk Cloud |
|---|---|---|---|---|
| Maximum Daily Indexing Volume | 500MB | 20GB | Unlimited | Unlimited |
| Maximum Users | 1 | 5 | Unlimited | Unlimited |
| Universal Data Collection/ Indexing | ||||
| Metrics Store | ||||
| Data Collection Add-Ons | ||||
| Monitoring and Alerting | ||||
| Dashboards and Reports | ||||
| Search and Analysis | ||||
| Event Annotation | ||||
| Automatic Data Enrichment | ||||
| Anomaly Detection | ||||
| Tables, Data Models and Pivot | ||||
| Splunkbase Apps | App for AWS (only) | |||
| Splunk Premium Solutions | ||||
| High Availability | ||||
| Disaster Recovery | ||||
| Clustering | ||||
| Distributed Search | ||||
| Performance Acceleration | ||||
| Access Control | User and Admin only | Granular and Customizable | Granular and Customizable | |
| Single Sign-On/LDAP | ||||
| Developer Environment | Full access to APIs and SDKs | Full access to APIs and SDKs | ||
| Support | Community | Standard | Enterprise/Global | Enterprise/Global |
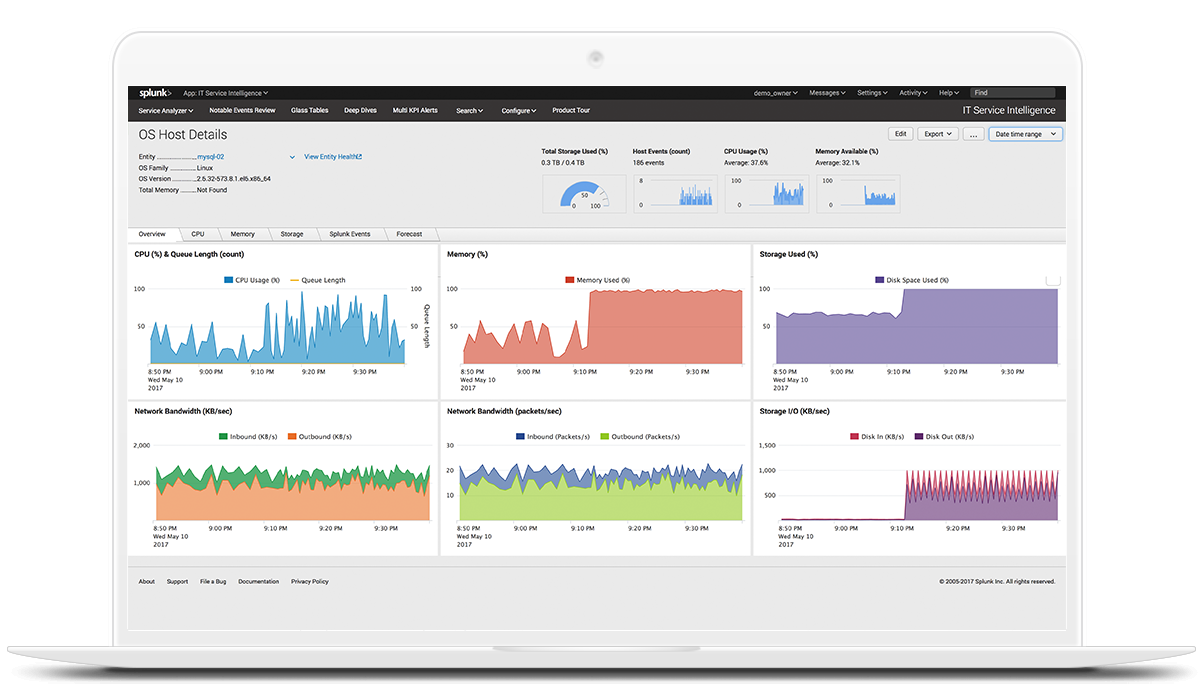
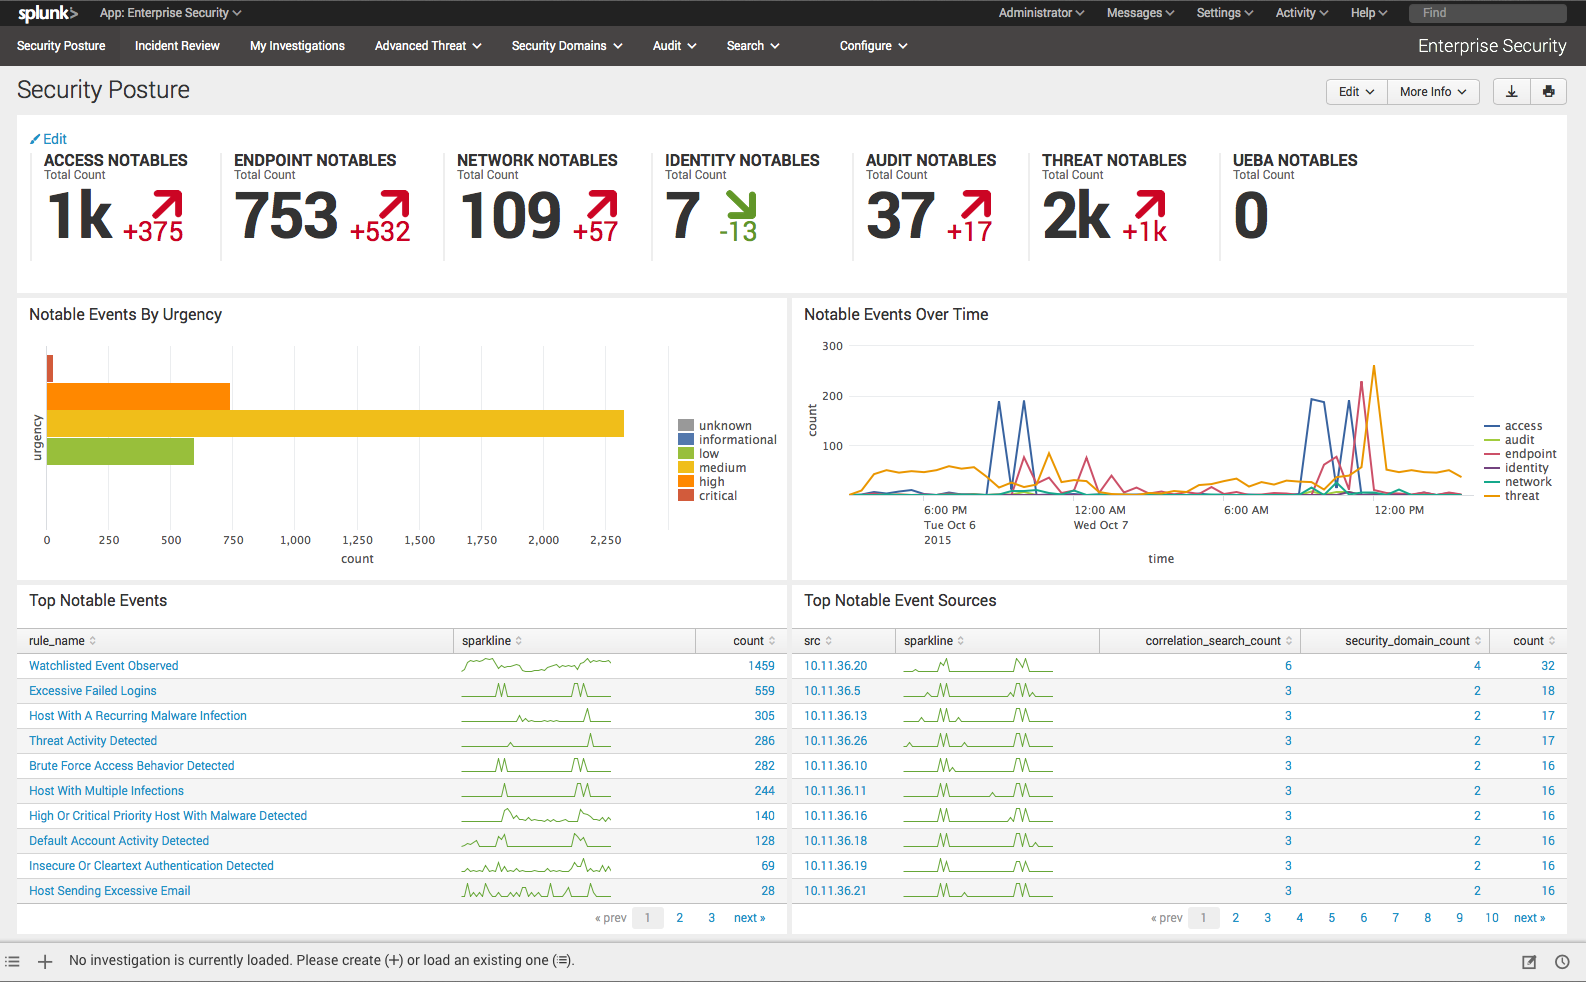
“The UBA anomalies can be used for multiple SIEM workflows to deter and resolve threats quicker and with greater precision. Hunters and analysts can now use the UBA detected anomalies as a source type within Splunk ES as a starting point of the investigation, do ad hoc searching and pivot for detailed Incident Review and Breach Analysis.”
src: https://www.splunk.com/en_us/products/features-comparison-chart.html
FireEye
https://en.wikipedia.org/wiki/FireEye
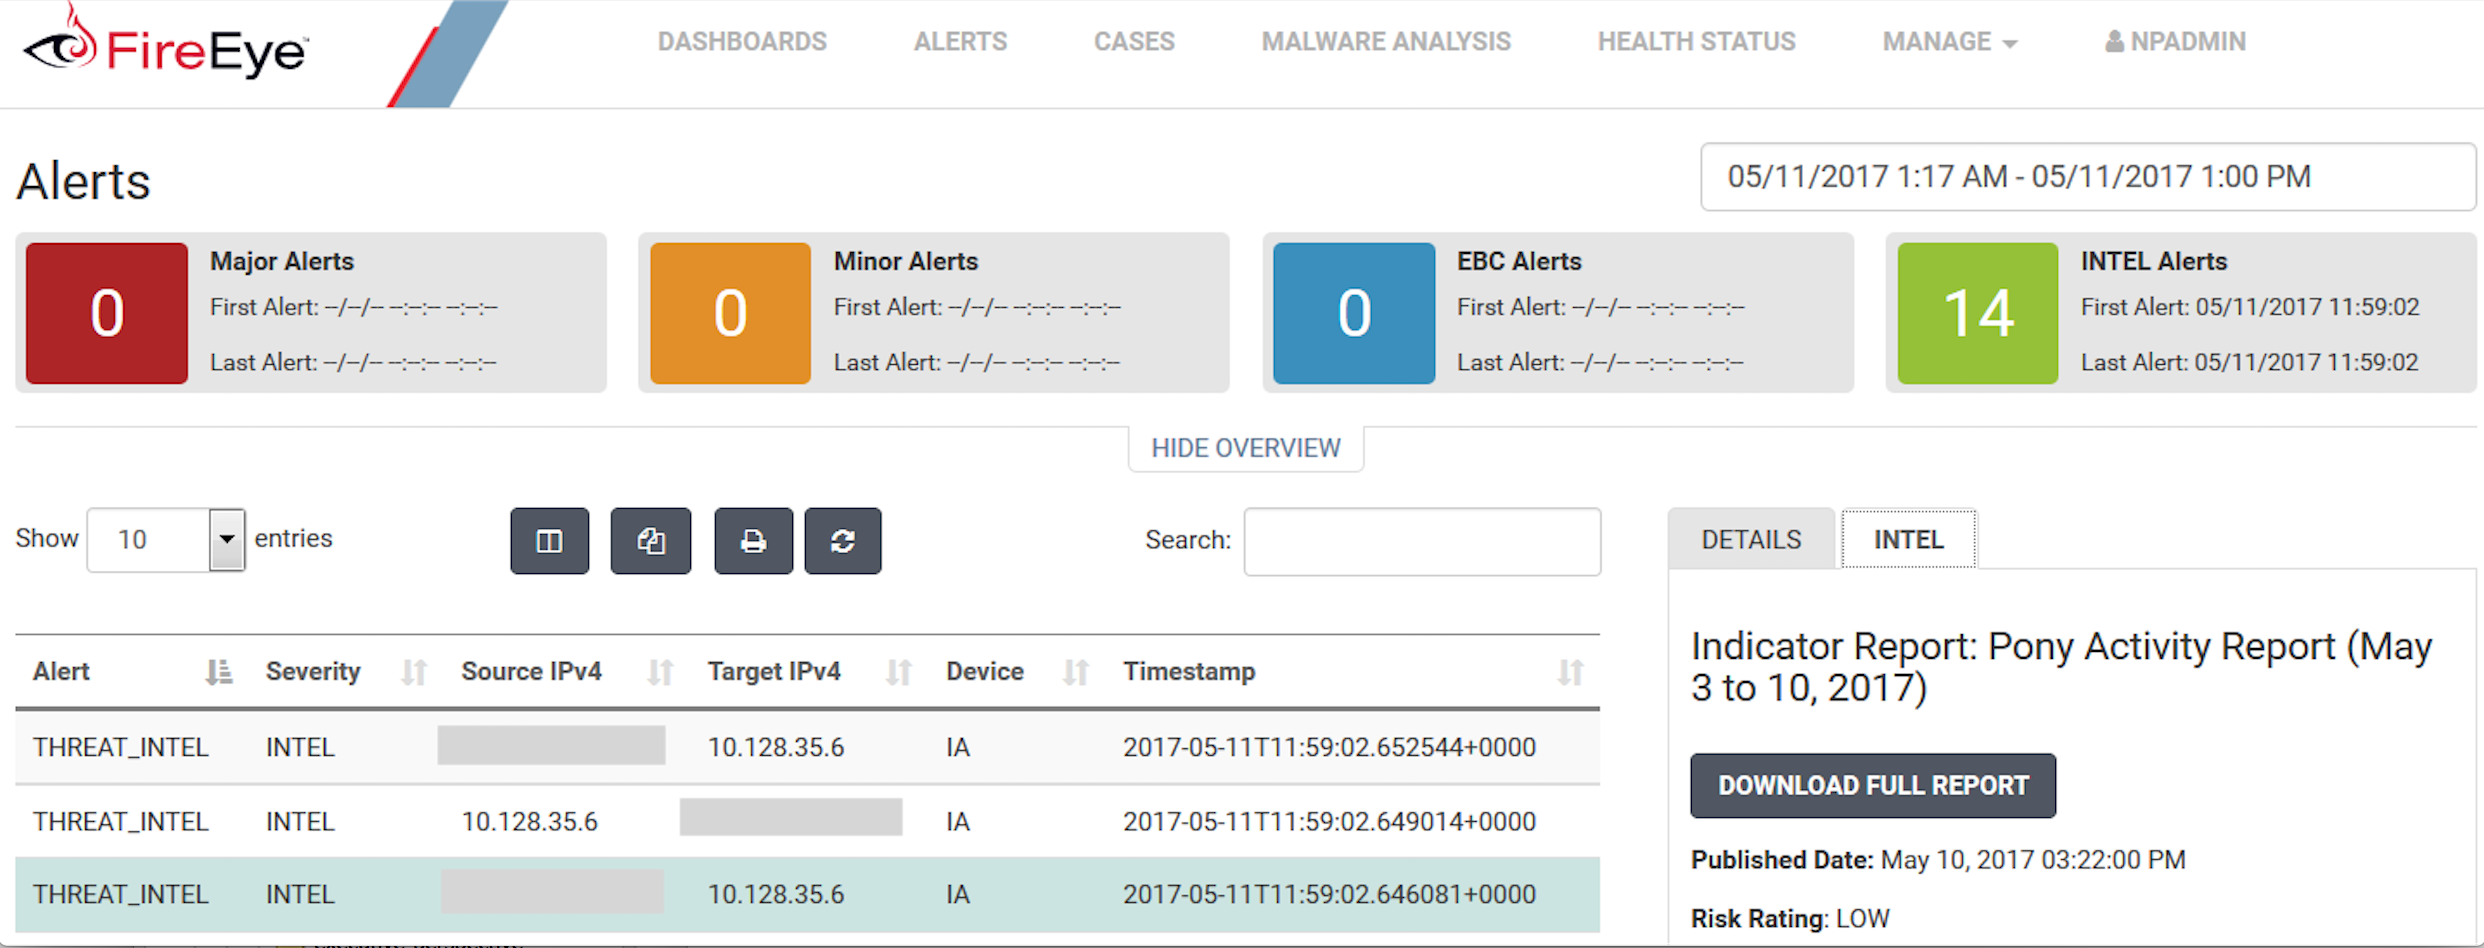
Unlike other vendors that provide raw threat data, FireEye delivers high-fidelity intelligence derived from numerous sources across the globe, including human intelligence, open sources, active community engagement, connections to the threat underground and criminal marketplaces, and real-time data collected from a variety of technical sources.
The following are some of the major IOCs we can download and scan/alert on:
- Network: A list of blacklisted IPs throughout the world.
- File MD5: A list of Malicious file MD5sums.
- URL: A list of malicious URLs.
SpaceX is using:
ElasticSearch, Logstash, and Kibana (ELK stack)
Links:
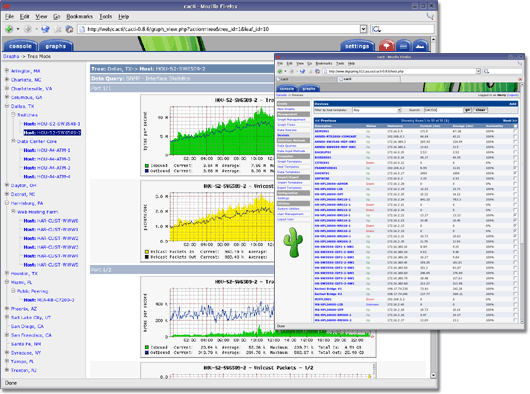
tools to grafically monitor/output/process all that collected sar-service data.
http://oss.oetiker.ch/rrdtool/
http://www.trickytools.com/php/sar2rrd.php
https://sourceforge.net/projects/zabbix/
https://sourceforge.net/projects/nagios/
https://www.linode.com/docs/uptime/monitoring/install-nagios-4-on-ubuntu-debian-8
https://wiki.ubuntuusers.de/Munin/
https://www.icinga.com/
https://sourceforge.net/projects/ksar/ – needs Java JRE
https://sourceforge.net/directory/system-administration/sysadministration/os:linux/
https://wiki.ubuntuusers.de/Netzwerk-Monitoring/
https://dwaves.de/2017/06/27/200-1-measure-and-troubleshoot-resource-usage/
liked this article?
- only together we can create a truly free world
- plz support dwaves to keep it up & running!
- (yes the info on the internet is (mostly) free but beer is still not free (still have to work on that))
- really really hate advertisement
- contribute: whenever a solution was found, blog about it for others to find!
- talk about, recommend & link to this blog and articles
- thanks to all who contribute!


