to be honest…
i find all of those meassurement tools too complicated to install.
they probably all have their validity – but why not simply do it like this:
given that you have a webserver installed and the web-root is /var/www/html (test that out before proceeding)
what do you want…
o grafical output of what the system load is
o how ressources CPU, RAM, HARDDISK are used and if there is a tendency of deplection – if yes – what process is causing it? (most of the time – what process is consuming most CPU time or RAM (in this wordpress blog case it is MySQL – reserving 4 out of 2 real existing Gbytes… ).
oo -> script should send E-Mail if harddisk has only 1-3 GByte space left… and a list of the directories the top30 directories that consume most harddisk space.
o what processes/files/directories are consuming most of the ressources
o easy to install/setup
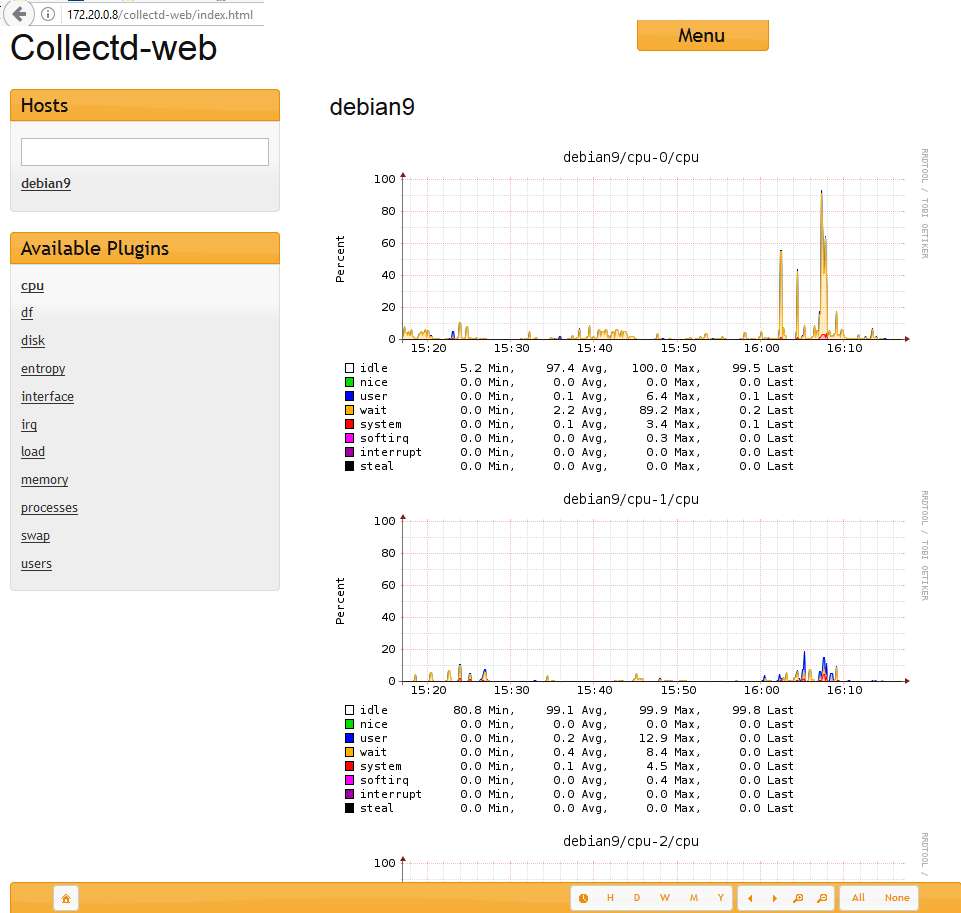
collectd might be just what you want.
tutorial howto setup and install -> https://dwaves.de/2017/07/17/debian9-stretch-basic-web-based-ressource-monitoring-with-collectd/
selfmade web based monitoring:
this is not really grafical, but i could put that together in php in one to three days…
similar to sar but less complicated 😀
1. download my example scripts
mkdir /scripts
cd /scripts
wget https://dwaves.de/wp-content/uploads/2017/06/usage.sh_.txt
wget https://dwaves.de/wp-content/uploads/2017/06/usage.cpu_.sh_.txt
mv usage.sh_.txt usage.sh;
mv usage.cpu_.sh_.txt usage.cpu.sh;
chmod +x usage.sh usage.cpu.sh; # mark it a runnable script
usage.cpu.sh script that will only record cpu usage over time and write it to /var/log/usage.cpu.txt
2. add job to crontab, add this line at the very end
crontab -e
  */1  *     *     *   *      /scripts/usage.sh
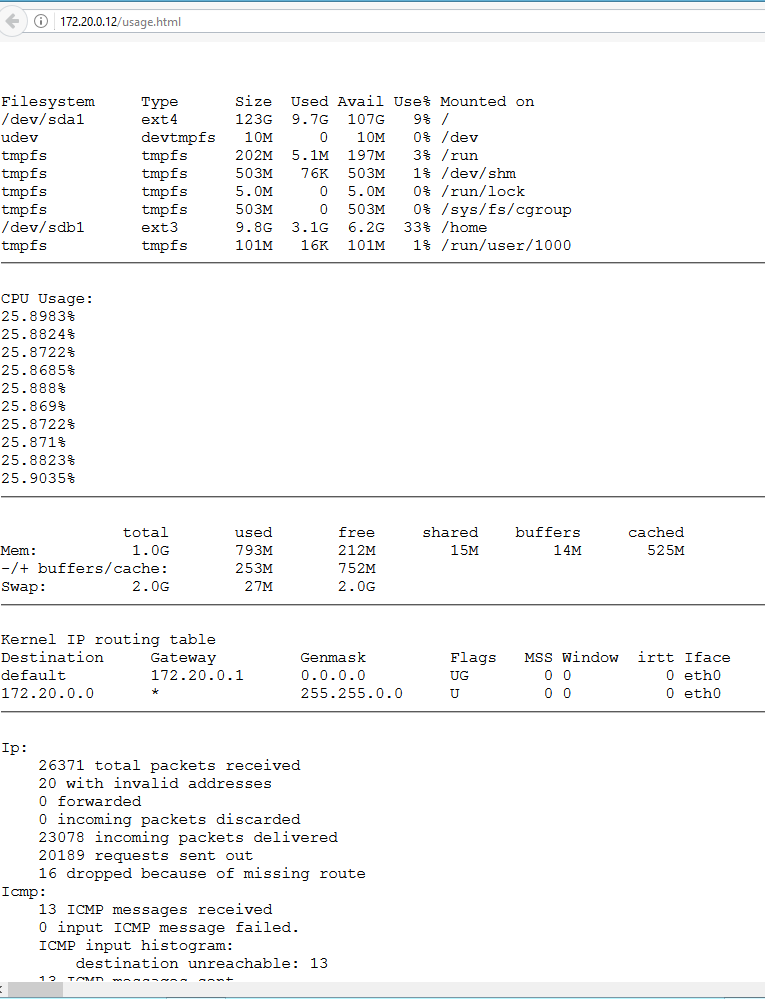
3. point your webbrowser to http://yourserver/usage.html
new data will get generated every minute, the view will auto-refresh every 30 seconds… simple as that.
output example:
sar
Collect, report, or save system activity information.
unfortunately no easy to install web gui frontend could be found – the kSar java application sucks and the python png generation sucks too.
install sar service and commands and other commands: /usr/bin/cifsiostat, /usr/bin/iostat, /usr/bin/mpstat, /usr/bin/nfsiostat-sysstat, /usr/bin/pidstat, /usr/bin/sadf, /usr/bin/tapestat
# debian
apt-get install sysstat iotop;

# centos / redhat
yum install sysstat iotop;

# suse
zypper install sysstat iotop;

# enable/autostart service on boot
systemctl enable sysstat.service;

# start service now
systemctl start sysstat.service;

# debian only: you will have to edit the
# config file and set ENABLED to "true"
vim /etc/default/sysstat;

# in order to make sadc collect info
# set enabled
sed -i 's/ENABLED="false"/ENABLED="true"/g' /etc/default/sysstat;

# restart to make service read config file
systemctl restart sysstat.service;

# look at the files involved on centos / redhat / suse
rpm -ql sysstat|less;

# look at the files involved on centos / redhat / suse
apt-get install apt-file && apt-file update && apt-file search sysstat;
after 10minutes you can look at the collected info:
systemctl status sysstat.service
● sysstat.service - LSB: Start/stop sysstat's sadc
 Loaded: loaded (/etc/init.d/sysstat)
 Active: active (exited) since Tue 2017-06-27 11:37:14 CEST; 8min ago

sar -A|less;
The sar command writes to standard output the contents of selected cumulative activity counters in the operating system.
The accounting system, based on the values in the count and interval parameters, writes information the specified number of times spaced at the specified intervals in seconds.
If the interval parameter is set to zero, the sar command displays the average statistics for the time since the system was started.
If the interval parameter is specified without the count parameter, then reports are generated continuously.
The collected data can also be saved in the file specified by the -o filename flag, in addition to being displayed onto the screen.
If filename is omitted, sar uses the standard system activity daily data file, the /var/log/sa/sadd file, where the dd parameter indicates the current day.
By default all the data available from the kernel are saved in the data file.
The sar command extracts and writes to standard output records previously saved in a file.
This file can be either the one specified by the -f flag or, by default, the standard system activity daily data file.
It is also possible to enter -1, -2 etc. as an argument to sar to display data of that days ago.
For example, -1 will point at the standard system activity file of yesterday.
Without the -P flag, the sar command reports system-wide (global among all processors) statistics, which are calculated as averages for values expressed as percentages, and as sums otherwise.
If the -P flag is given, the sar command reports activity which relates to the specified processor or processors.
If -P ALL is given, the sar command reports statistics for each individual processor and global statistics among all processors.
You can select information about specific system activities using flags.
Not specifying any flags selects only CPU activity. Specifying the -A flag selects all possible activities.
The default version of the sar command (CPU utilization report) might be one of the first facilities the user runs to begin system activity investigation, because it monitors major system resources.
If CPU utilization is near 100 percent (user + nice + system), the workload sampled is CPU-bound.
If multiple samples and multiple reports are desired, it is convenient to specify an output file for the sar command.
Run the sar command as a background process.
The syntax for this is:
sar -o datafile interval count >/dev/null 2>&1 &
All data are captured in binary form and saved to a file (datafile).
The data can then be selectively displayed with the sar command using the -f option.
Set the interval and count parameters to select count records at interval second intervals.
If the count parameter is not set, all the records saved in the file will be selected.
Collection of data in this manner is useful to characterize system usage over a period of time and determine peak usage hours.
Note: The sar command only reports on local activities.
Links:
tools to grafically monitor/output/process all that collected sar-service data.
http://oss.oetiker.ch/rrdtool/
http://www.trickytools.com/php/sar2rrd.php
https://sourceforge.net/projects/zabbix/
https://sourceforge.net/projects/nagios/
https://www.linode.com/docs/uptime/monitoring/install-nagios-4-on-ubuntu-debian-8
https://wiki.ubuntuusers.de/Munin/
https://www.icinga.com/
https://sourceforge.net/projects/ksar/ – needs Java JRE
https://sourceforge.net/directory/system-administration/sysadministration/os:linux/
https://wiki.ubuntuusers.de/Netzwerk-Monitoring/
Videos:
Manpages:
about cacti
changelog: http://www.cacti.net/changelog.php
@github: https://github.com/Cacti/cacti/
Cacti is a complete network graphing solution designed to harness the power of RRDTool’s data storage and graphing functionality. Cacti provides following features:
- remote and local data collectors
- network discovery
- device management automation
- graph templating
- custom data acquisition methods
- user, group and domain management
- C3 level security settings for local accounts
- strong password hashing
- forced regular password changes, complexity, and history
- account lockout support
All of this is wrapped in an intuitive, easy to use interface that makes sense for both LAN-sized installations and complex networks with thousands of devices.
Developed in the early 2000’s by Ian Berry as a high school project, it has been used by thousands of companies and enthusiasts to monitor and manage their Networks and Data Centers.
Requirements
Cacti should be able to run on any Linux, UNIX, or Windows based operating system with the following requirements:
- PHP 5.3+
- MySQL 5.1+ / MariaDB
- RRDTool 1.3+, 1.5+ recommended
- NET-SNMP 5.5+
- Web Server with PHP support
- sysstat.service / sadc service needs to be running i guess…
PHP Must also be compiled as a standalone cgi or cli binary. This is required for data gathering via cron.
install on debian8
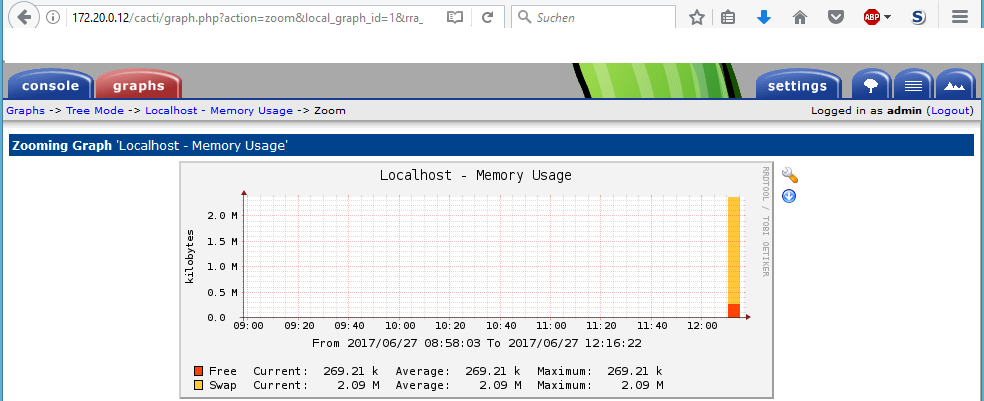
# install apache2, mysql5, php, cacti apt-get install cacti;well... okay?
http://your-server/cacti/
default user and password are:
usr: admin
pwd: admin
wait for data to be collected…
cacti config templates
Assume, you’re searching for a specific set of templates to monitor a special type of device. Apart from designing templates from scratch, there’s a good chance to find a solution in the Scripts and Templates Forum. The set of templates is usually provided as a single XML file holding all required definitions for a data template and a graph template. Depending on the goal of the original author, he/she may have provided a host template as well as part of this XML file.
http://www.debianhelp.co.uk/cactitemplates.htm
Note About RRDtool
RRDTool is available in multiple versions and a majority of them are supported by Cacti. Please remember to confirm your Cacti settings for the RRDtool version if you having problem rendering graphs.
Contribute
Check out the main Cacti web site for downloads, change logs, release notes and more!
Community
Given the large scope of Cacti, the forums tend to generate a respectable amount of traffic. Doing your part in answering basic questions goes a long way since we cannot be everywhere at once. Contribute to the Cacti community by participating on the Cacti Community Forums.
Development
Get involved in development of Cacti! Join the developers and community on GitHub!
Abilities of Cacti
Data Sources
Cacti handles the gathering of data through the concept of data sources. Data sources utilize input methods to gather data from devices, hosts, databases, scripts, etc… The possibilities are endless as to the nature of the data you are able to collect. Data sources are the direct link to the underlying RRD files; how data is stored within RRD files and how data is retrieved from RRD files.
Graphs
Graphs, the heart and soul of Cacti, are created by RRDtool using the defined data sources definition.
Templating
Bringing it all together, Cacti uses and extensive template system that allows for the creation and consumption of portable templates. Graph, data source, and RRA templates allow for the easy creation of graphs and data sources out of the box. Along with the Cacti community support, templates have become the standard way to support graphing any number of devices in use in today computing and networking environments.
Data Collection AKA Poller
Local and remote data collection support with the ability to set collection intervals. Check out Data Source Profile with in Cacti for more information. Data Source Profiles can be applied to graphs at creation time or at the data template level.
Remote data collection has been made easy through replication of resources to remote data collectors. Even when connectivity to the main Cacti installation is lost from remote data collector, it will store collected data until connectivity is restored. Remote data collection only requires MySQL and HTTP/HTTPS access back to the main Cacti installation location.
User Interface Enhancements
The user interface experience has been enhanced from previous version of Cacti. There has been efforts to migrate to using client side web 2.0 techniques to improve the usability and functionality of the web interface. As a neat side effect Cacti now supports user interface skins to have a customizable experience.
Network Discovery and Automation
Cacti provides administrators a series of network automation functionality in order to reduce the time and effort it takes to setup and manage a devices. This includes:
- Support for multiple network discovery rules
- Device, graph and tree automation templates that allow administrators to dictate actions on adding devices automatically
Plugin Framework
Cacti is more than a network monitoring system, it is an operations framework that allows the extension and augmentation of Cacti functionality. The Cacti Group continues to maintain an assortment of plugins. If you are looking to add features to Cacti, there is quite a bit of reference material to choose from on GitHub.
Dynamic Graph Viewing Experience
Cacti allows for many runtime augmentations while viewing graphs:
- Dynamically loaded tree and graph view
- Searching by string, graph and template types
- Viewing augmentation
- Simple time span adjustments
- Convenient sliding time window buttons
- Single click realtime graph option
- Easy graph export to csv
- RRA view with just a click
User, Groups and Permissions
Support for per user and per group permissions at a per realm (area of Cacti), per graph, per graph tree, per device, etc… The permission model in Cacti is role based access control (RBAC) to allow for flexible assignment of permissions. Support for enforcement of password complexity, password age and changing of expired passwords.
Extensive RRDtool Graph Option Support
Cacti supports more RRDtool Graph options as of version 1.0.0 including:
Graphs Templates
- Full right axis
- Shift
- Dash and dash offset
- Alt y-grid
- No grid fit
- Units length
- Tab width
- Dynamic labels
- Rules legend
- Legend position
Graph Template Items
- VDEF’s
- Stacked lines
- User definable line widths
- Text alignment
Additionally the ability to manage RRD files that Cacti creates and uses has been added. The ability to fix up graph data is available while viewing graphs to allow for easy removal of spikes or filling of missing areas of data.
Cacti 1.0.0
With the release of Cacti 1.0.0 many improvements and enhancements have been made. As part of ongoing efforts to improve Cacti almost 20 plugins were merged into the core of Cacti eliminating the need for the plugins. A major refresh of the interface has been started and will continue to occur as development on Cacti continues.
Plugins Absorbed into the Core
The following plugins have been merged into the core Cacti code as of version 1.0.0:
| Plugin | Description |
|---|---|
| snmpagent | An SNMP Agent extension, trap and notification generator |
| clog | Log viewers for administrators |
| settings | Core plugin providing email and DNS services |
| boost | Large system performance boost plugin |
| dsstats | Cacti data source statistics |
| watermark | Watermark graphs |
| ssl | Force https connection |
| ugroup | User groups support |
| domains | Multiple authentication domains |
| jqueryskin | User interface skinning |
| secpass | C3 level password and site security |
| logrotate | Log management |
| realtime | Realtime graphing |
| rrdclean | RRD file maintenance |
| nectar | Email based graph reporting |
| aggregate | Templating, creation and management of aggregate graphs |
| autom8 | Graph and Tree creation automation |
| discovery | Network Discovery and Device automation |
| spikekill | Removes spikes from Graphs |
| superlinks | Allows administrators to links to additional sites |
liked this article?
- only together we can create a truly free world
- plz support dwaves to keep it up & running!
- (yes the info on the internet is (mostly) free but beer is still not free (still have to work on that))
- really really hate advertisement
- contribute: whenever a solution was found, blog about it for others to find!
- talk about, recommend & link to this blog and articles
- thanks to all who contribute!


